Torrance: Fire Incidents, California (CA)
Where are fire incidents reported in Torrance, CA
Something went wrong! Please refresh the page.
| Fire incidents reported | |
|---|---|
| Sreet name | Count |
| HAWTHORNE BLVD | 234 |
| 190TH ST | 232 |
| CRENSHAW BLVD | 212 |
| PACIFIC COAST HWY | 114 |
| CARSON ST | 112 |
| SEPULVEDA BLVD | 100 |
| ANZA AVE | 94 |
| TORRANCE BLVD | 82 |
| WESTERN AVE | 78 |
| 182ND ST | 72 |
| REDONDO BEACH BLVD | 68 |
| PLAZA DEL AMO | 66 |
| ARTESIA BLVD | 58 |
| I 405 FWY | 56 |
| 235TH ST | 46 |
| CABRILLO AVE | 46 |
| EMERALD ST | 36 |
| ARLINGTON AVE | 34 |
| MARICOPA ST | 32 |
| PRAIRIE AVE | 32 |
| KINGSDALE AVE | 30 |
| 227TH ST | 28 |
| DEL AMO BLVD | 28 |
| SKYPARK DR | 28 |
| AMAPOLA AVE | 26 |
| PASEO DE LA PLAYA | 26 |
| VAN NESS AVE | 26 |
| PALOS VERDES BLVD | 24 |
| 226TH ST | 22 |
| SPENCER ST | 22 |
2005 - 2018 National Fire Incident Reporting System (NFIRS) incidents
- Incident types reported to NFIRS in Torrance, CA
- 42,73767.0%Rescue & EMS
- 5,6358.8%Hazardous Condition
- 5,1128.0%Service Call
- 4,4817.0%Good Intent Call
- 3,8236.0%False Alarm
- 1,8853.0%Fire
- 700.1%Special Incident
- Fire incident types reported to NFIRS in Torrance, CA
- 85245.2%Outside Fires
- 53628.4%Structure Fires
- 37619.9%Mobile Property/Vehicle Fires
- 1216.4%Other
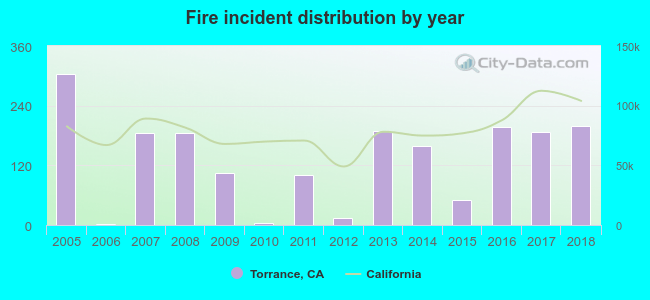 Based on the data from the years 2005 - 2018 the average number of fires per year is 135. The highest number of reported fires - 304 took place in 2005, and the least - 3 in 2006. The data has a decreasing trend.
The average number of yearly fire incidents per 10k residents in Torrance, CA compared to nearest cities:
(Note: Based on data for the last 3 years, including only cities with population 5,000 and above)
| Torrance: | 13.1 |
| Redondo Beach: | 17.9 |
| Lomita: | 13.0 |
| Lawndale: | 14.3 |
| Hermosa Beach: | 8.2 |
| Gardena: | 27.7 |
| Carson: | 21.2 |
| Manhattan Beach: | 13.8 |
| Rancho Palos Verdes: | 9.4 |
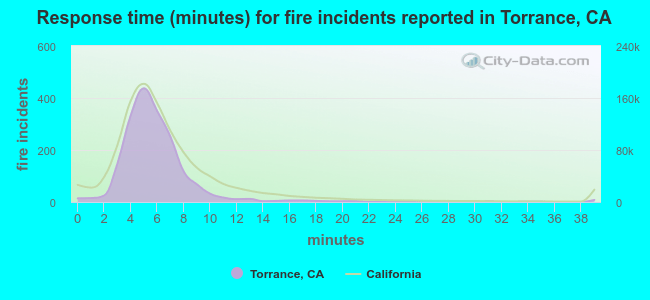 The median response time based on all reported fire incidents is 5 minutes. This is lower than the California median value.
The median response time in Torrance, CA compared to nearest cities:
(Note: Based on data for all years, including only cities with at least 500 fire incidents)
| Torrance: | 5 minutes |
| Redondo Beach: | 5 minutes |
| Hermosa Beach: | 5 minutes |
| Gardena: | 5 minutes |
| Carson: | 4 minutes |
| Manhattan Beach: | 5 minutes |
| Hawthorne: | 4 minutes |
| El Segundo: | 5 minutes |
| Compton: | 6 minutes |
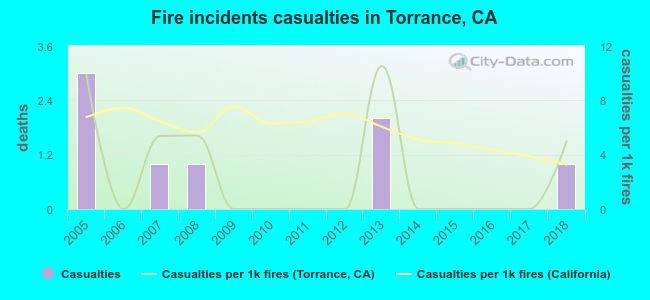 Based on the reports from the years 2005 - 2018 the average number of fire-related yearly casualties is 1. The highest number of reported casualties - 3 took place in 2005, and the lowest - 0 in 2006. The data has a dropping trend.
The average number of casualties per 1,000 fires is 3. This indicator was the highest - 11 in 2013, and the lowest 0 in 2006. The trend for injuries per 1,000 incidents is decreasing. Compared to the California value the number of casualties per 1,000 incidents is lower.
Based on the reports from the years 2005 - 2018 the average number of fire-related yearly casualties is 1. The highest number of reported casualties - 3 took place in 2005, and the lowest - 0 in 2006. The data has a dropping trend.
The average number of casualties per 1,000 fires is 3. This indicator was the highest - 11 in 2013, and the lowest 0 in 2006. The trend for injuries per 1,000 incidents is decreasing. Compared to the California value the number of casualties per 1,000 incidents is lower.Casualties per 1,000 incidents in Torrance, CA compared to nearest cities:
(Note: Based on data for all years, including only cities with at least 500 fire incidents)
| Torrance: | 4.2 |
| Redondo Beach: | 3.2 |
| Hermosa Beach: | 6.1 |
| Gardena: | 1.4 |
| Carson: | 1.5 |
| Manhattan Beach: | 0.0 |
| Hawthorne: | 0.5 |
| El Segundo: | 1.5 |
| Compton: | 1.0 |
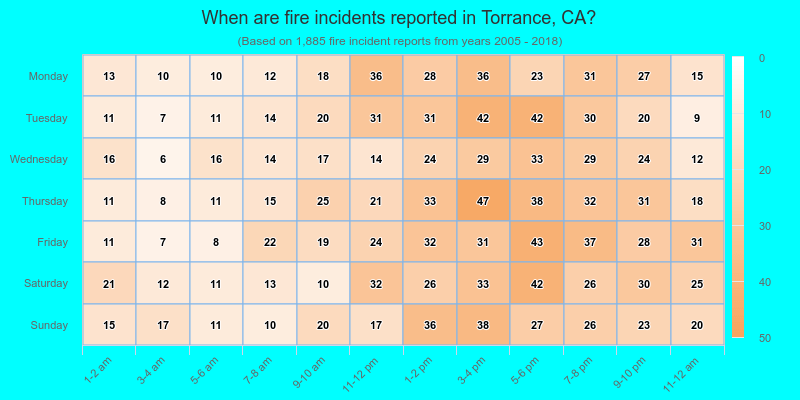
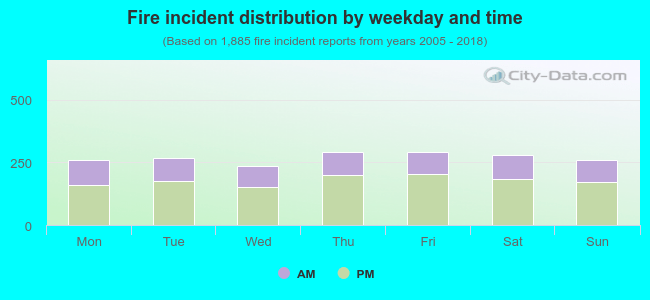 34.3% incidents where reported in the morning and 65.7% in the evening. The most fires (15.5%) took place on Friday, and the least (12.4%) on Wednesday.
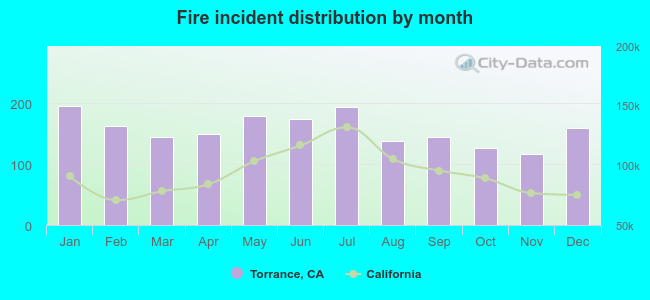 According to the 1,885 fires from years 2005 - 2018 most fires (10.4%) took place during January, and the least (6.2%) in November.
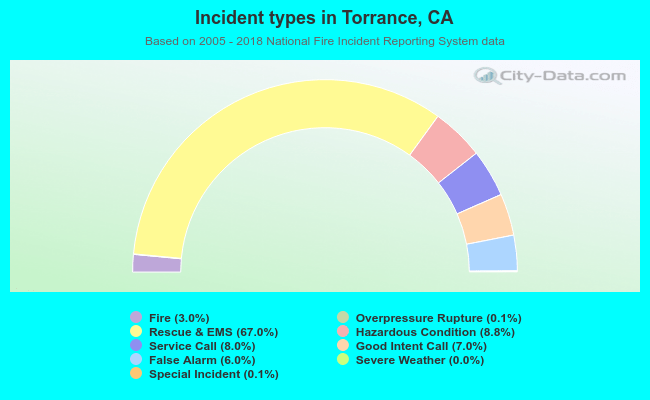 Out of all 63,807 cases reported during the years 2005 - 2018, the most belonged to the categories: Rescue & EMS (67.0%), Hazardous Condition (8.8%), and Service Call (8.0%).
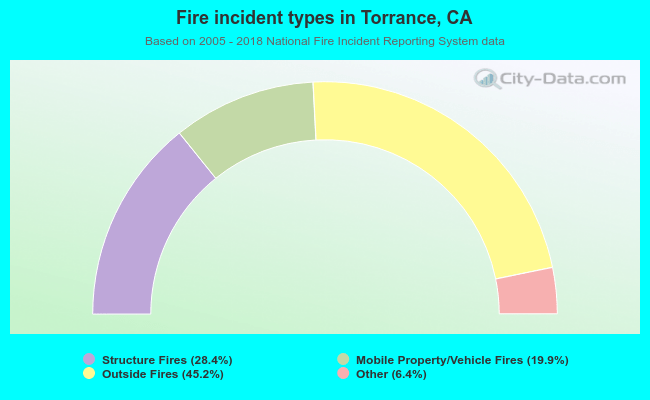 When looking into fire subcategories, the most reports belonged to: Outside Fires (45.2%), and Structure Fires (28.4%).