Tool: Fire Incidents, Texas (TX)
Where are fire incidents reported in Tool, TX
Something went wrong! Please refresh the page.
|
| |||||||||||||||||||||||||||||||||||||||||||||||||||||||||||||||||||||||||||||||||||||||||||||||||||||||||||||
2004 - 2018 National Fire Incident Reporting System (NFIRS) incidents
- Incident types reported to NFIRS in Tool, TX
- 73942.4%Rescue & EMS
- 53330.6%Fire
- 22613.0%Service Call
- 1347.7%Hazardous Condition
- 714.1%Good Intent Call
- 221.3%False Alarm
- 100.6%Special Incident
- 50.3%Severe Weather
- Fire incident types reported to NFIRS in Tool, TX
- 27251.0%Outside Fires
- 18835.3%Structure Fires
- 417.7%Other
- 326.0%Mobile Property/Vehicle Fires
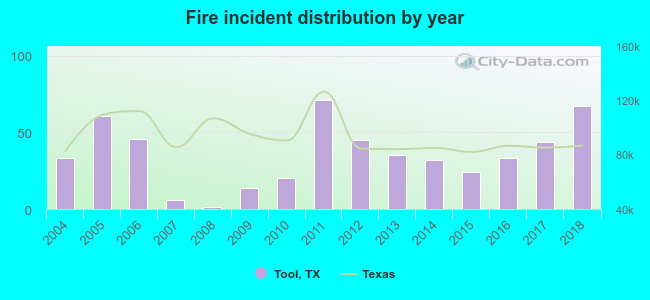 Based on the data from the years 2004 - 2018 the average number of fires per year is 35. The highest number of reported fires - 71 took place in 2011, and the least - 1 in 2008. The data has a rising trend.
 The median response time based on all reported fire incidents is 9 minutes. This is higher compared to the state median value.
The median response time in Tool, TX compared to nearest cities:
(Note: Based on data for all years, including only cities with at least 500 fire incidents)
| Tool: | 9 minutes |
| Gun Barrel City: | 6 minutes |
| Seven Points: | 10 minutes |
| Payne Springs: | 10 minutes |
| Mabank: | 9 minutes |
| Eustace: | 10 minutes |
| Trinidad: | 5 minutes |
| Kerens: | 13 minutes |
| Kemp: | 12 minutes |
 34.5% incidents where reported in the morning and 65.5% in the evening. The most fires (18.6%) took place on Monday, and the least (11.1%) on Sunday.
 Based on the 533 incident reports from years 2004 - 2018 most fires (11.4%) took place during August, and the least (5.1%) in May.
 Out of all 1,741 cases reported during the years 2004 - 2018, the most belonged to the categories: Rescue & EMS (42.4%), Fire (30.6%), and Service Call (13.0%).
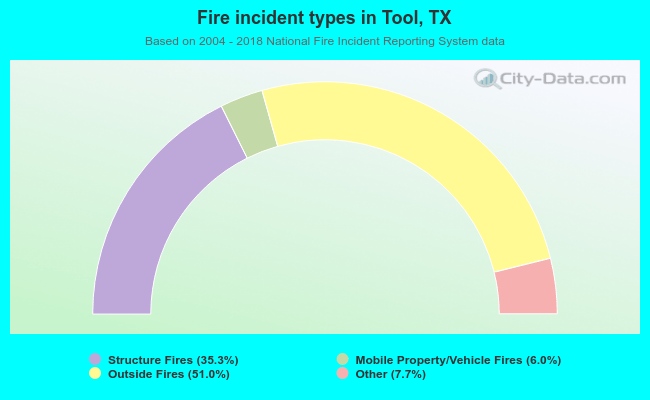 When looking into fire subcategories, the most incidents belonged to: Outside Fires (51.0%), and Structure Fires (35.3%).