| Fire incidents reported |
|---|
| Sreet name | Count |
|---|
| JACKSON HOLLOW RD | 8 | | BULLEN VALLEY RD | 6 | | CLAUDE WOLFENBARGER RD | 6 | | HWY 131 | 6 | | 25E HWY | 4 | | ALLEN LN | 4 | | CLINCH VALLEY RD | 4 | | DRY VALLEY ROAD RD | 4 | | PAW PAW RD | 4 | | RACUM RD | 4 | | WALLEN LANE | 4 | | WAR CREEK RD | 4 | | 1200 OLD 25E | 2 | | 1403 CEDAR SPRINGS RD | 2 | | 25 E | 2 | | 375 THORN HILL CHURCH RD | 2 | | 672 DALTON RIDGE RD | 2 | | 681 OLD MOUNTAIN RD | 2 | | 774 OLD HIGHWAY 25 E | 2 | | 934 BEACH GROVE RD RD | 2 | | BEAR HOLLOW RD | 2 | | BOOTS DALTON LN | 2 | | BRIAN DR | 2 | | BROKEN VALLEY RD | 2 | | BULLEN VALLEY AT DALTON CEM RD | 2 |
| | | Fire incidents reported |
|---|
| Sreet name | Count |
|---|
| BULLEN VALLEY ROAD | 2 | | CARPENTER LN. | 2 | | CEDAR SPRINGS RD | 2 | | CLAUDE WOLFENBARGER RD RD | 2 | | CLAUDE WOLFENBARGER RD RDS | 2 | | CLAUDE WOLFENBARGER ROAD | 2 | | CLINCH MTN LOOKOUT | 2 | | CLINCH VALLEY RD | 2 | | COFFEY CHAPEL RD | 2 | | COFFEY CHAPEL RD | 2 | | CONDRY BEND | 2 | | COOL BRANCH RD | 2 | | COOL BRANCH RD | 2 | | COPPER RIDGE RD | 2 | | COX LANE | 2 | | COX LANE | 2 | | DALTON RIDGE | 2 | | ELROD CIR | 2 | | FIRE TOWER RD | 2 | | FRANK ATKINS RD | 2 | | GORDON LN | 2 | | HAYES MTN LANE | 2 | | HIGHWAY 25-E | 2 | | HIGHWAY25-E TOP OF MTN | 2 | | HWY 25-E | 2 |
|
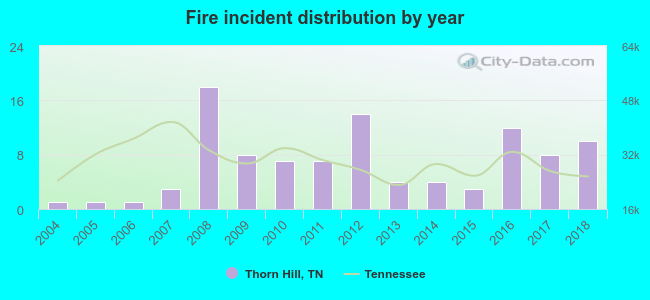 Based on the data from the years 2004 - 2018 the average number of fire incidents per year is 7. The highest number of fires - 18 took place in 2008, and the least - 1 in 2004. The data has a rising trend.
 32.7% incidents where reported in the morning and 67.3% in the evening. The most fires (15.8%) took place on Wednesday, and the least (10.9%) on Monday.
 According to the 101 reports from years 2004 - 2018 most fires (20.8%) took place during November, and the least (2.0%) in August.
 Out of all 168 cases reported during the years 2004 - 2018, the most belonged to the categories: Fire (60.1%), Overpressure Rupture (19.0%), and Service Call (8.9%).
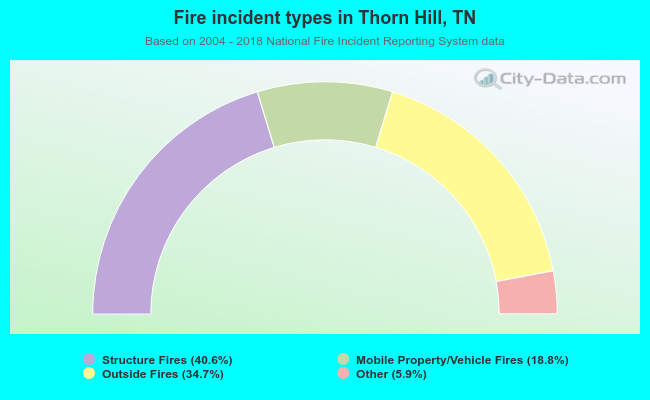 When looking into fire subcategories, the most reports belonged to: Structure Fires (40.6%), and Outside Fires (34.7%).