Sylvan Springs: Fire Incidents, Alabama (AL)
Where are fire incidents reported in Sylvan Springs, AL
Something went wrong! Please refresh the page.
|
| |||||||||||||||||||||||||||||||||||||||||||||||||||||||||||||||||||||||||||||||||||||||||||||||||||||||||||||
2006 - 2018 National Fire Incident Reporting System (NFIRS) incidents
- Incident types reported to NFIRS in Sylvan Springs, AL
- 82751.0%Rescue & EMS
- 24615.2%Good Intent Call
- 23014.2%Fire
- 20012.3%Service Call
- 664.1%Hazardous Condition
- 483.0%False Alarm
- 30.2%Severe Weather
- 30.2%Special Incident
- Fire incident types reported to NFIRS in Sylvan Springs, AL
- 14161.3%Outside Fires
- 7130.9%Structure Fires
- 135.7%Mobile Property/Vehicle Fires
- 52.2%Other
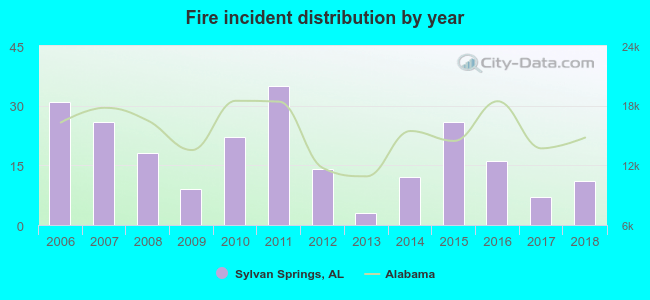 Based on the data from the years 2006 - 2018 the average number of fires per year is 18. The highest number of reported fire incidents - 35 took place in 2011, and the least - 3 in 2013. The data has a dropping trend.
 Based on the data from the years 2006 - 2018 the average number of fire-related yearly casualties is 0. The highest number of reported injuries - 1 took place in 2006, and the lowest - 0 in 2008. The data has a declining trend.
 32.2% incidents where reported in the morning and 67.8% in the evening. The most fires (17.0%) took place on Tuesday, and the least (12.2%) on Saturday.
 Based on the 230 fire incident reports from years 2006 - 2018 most fires (14.8%) took place during February, and the least (3.0%) in October.
 Out of all 1,623 cases reported during the years 2006 - 2018, the most belonged to the categories: Overpressure Rupture (51.0%), Service Call (15.2%), and Fire (14.2%).
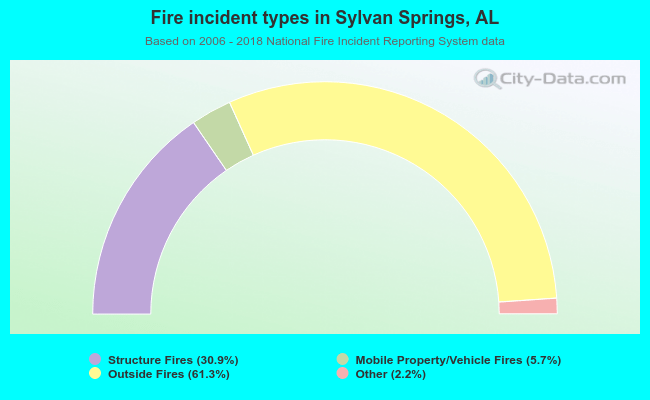 When looking into fire subcategories, the most reports belonged to: Outside Fires (61.3%), and Structure Fires (30.9%).