| Fire incidents reported |
|---|
| Sreet name | Count |
|---|
| CR 257 | 12 | | BLUEWATER HIGHWAY | 8 | | BEACH DRIVE | 6 | | DRIFTWOOD | 6 | | JETTY PARK | 6 | | SEASHELL | 6 | | 257 CR | 4 | | BLUEWATER HWY | 4 | | HWY 332 | 4 | | SALT GRASS ST | 4 | | SANDPEBBLE PL | 4 | | SWAN CT. | 4 | | THUNDER | 4 | | TREATY DR | 4 | | !00 PAKVIEW/JETTYVIEW | 2 | | 1 MILE N OF ACCESS 1BAYSIDE | 2 | | 1/2 MILE PAST 332 BEACH ENTER. | 2 | | 1/4 MILE FROM BEACH ENTRANCE | 2 | | 100 BLK. CR 257 | 2 | | 100 OCEAN AVE. | 2 | | 1038 CANAL ST. | 2 | | 10820 BLUEWATER HWY | 2 | | 112 MAR VISTA | 2 | | 1122 GULFVIEW | 2 | | 122 TREATY | 2 |
| | | Fire incidents reported |
|---|
| Sreet name | Count |
|---|
| 1313 SURF DR. | 2 | | 1430 BLUEWATER HWY. | 2 | | 1818 CR 257 | 2 | | 1863 BLUEWATER HWY. | 2 | | 211 POMPANO | 2 | | 215 SPOONBILL | 2 | | 2200 CR257 | 2 | | 266 SWORDFISH | 2 | | 300 BLK OF TREATY | 2 | | 300 BLK PARKVIEW | 2 | | 3005 CR 257 | 2 | | 309 OCEAN | 2 | | 314 BEACH | 2 | | 320 THUNDER & MIDDDLE | 2 | | 323 OCEAN | 2 | | 332 & CORAL STREET | 2 | | 332 HWY | 2 | | 332/BEACH ENTRANCE | 2 | | 332/BY THE BRIDGE | 2 | | 332MAIN ENTRANCE | 2 | | 4502 BLUEWATER HIGHWAY | 2 | | 606 SEASHELL | 2 | | 701 SEASHELL | 2 | | 900 BLOCK ON THE BEACH | 2 | | |
|
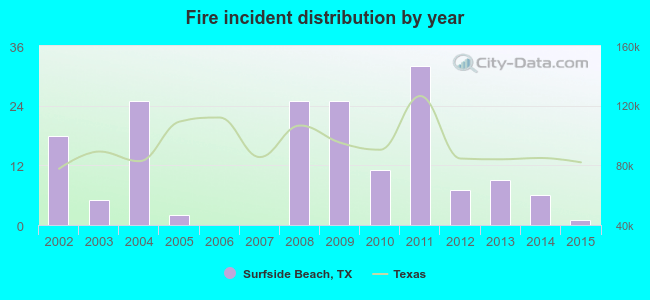 According to the data from the years 2002 - 2015 the average number of fire incidents per year is 12. The highest number of reported fire incidents - 32 took place in 2011, and the least - 0 in 2006. The data has a declining trend.
 32.5% incidents where reported in the morning and 67.5% in the evening. The most fires (23.5%) took place on Sunday, and the least (5.4%) on Wednesday.
 According to the 166 incident reports from years 2002 - 2015 most fires (22.9%) took place during July, and the least (1.8%) in January.
 Out of all 212 cases reported during the years 2002 - 2015, the most belonged to the categories: Fire (78.3%), Rescue & EMS (17.0%), and Service Call (2.4%).
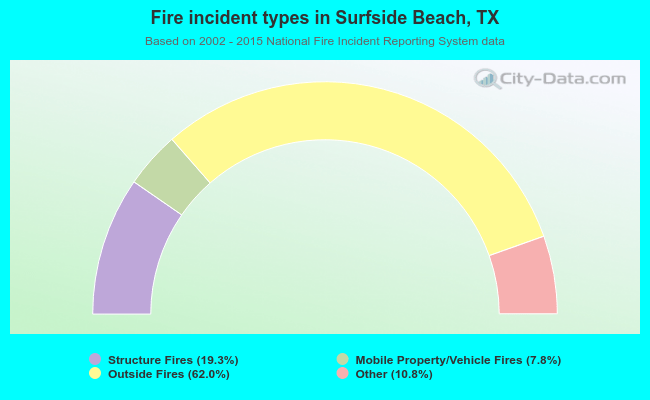 When looking into fire subcategories, the most reports belonged to: Outside Fires (62.0%), and Structure Fires (19.3%).