Stockton: Fire Incidents, California (CA)
Where are fire incidents reported in Stockton, CA
Something went wrong! Please refresh the page.
| Fire incidents reported | |
|---|---|
| Sreet name | Count |
| FREMONT ST | 546 |
| EL DORADO ST | 478 |
| WILSON | 446 |
| AURORA ST | 390 |
| MAIN ST | 384 |
| MARCH LN | 382 |
| HAZELTON | 380 |
| STANISLAUS ST | 336 |
| CALIFORNIA ST | 332 |
| HAMMER LN | 324 |
| WATERLOO RD | 324 |
| WEST LN | 292 |
| LAFAYETTE ST | 290 |
| MARCH LANE | 286 |
| SAN JOAQUIN ST | 286 |
| LINCOLN ST | 284 |
| I-5 FWY | 274 |
| AIRPORT | 270 |
| CHURCH ST | 268 |
| DR MARTIN LUTHER KING JR | 260 |
| WASHINGTON ST | 258 |
| ANDERSON ST | 252 |
| PACIFIC | 250 |
| ALPINE | 246 |
| UNION ST | 240 |
| MARIPOSA RD | 232 |
| HAMMER LANE | 224 |
| CENTER ST | 214 |
| WEBER | 212 |
| SCOTTS | 208 |
| Other | 8,250 |
2005 - 2018 National Fire Incident Reporting System (NFIRS) incidents
- Incident types reported to NFIRS in Stockton, CA
- 87,13052.7%Rescue & EMS
- 38,34823.2%Good Intent Call
- 17,41810.5%Fire
- 10,9156.6%Service Call
- 6,1773.7%False Alarm
- 4,9913.0%Hazardous Condition
- 1690.1%Special Incident
- Fire incident types reported to NFIRS in Stockton, CA
- 11,72167.3%Outside Fires
- 2,77515.9%Structure Fires
- 2,54214.6%Mobile Property/Vehicle Fires
- 3802.2%Other
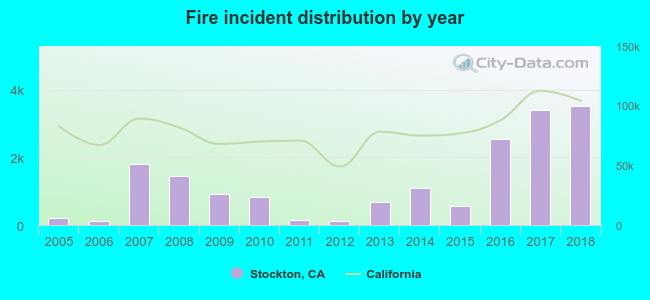 According to the data from the years 2005 - 2018 the average number of fires per year is 1,244. The highest number of fires - 3,533 took place in 2018, and the least - 106 in 2012. The data has a growing trend.
The average number of yearly fire incidents per 10k residents in Stockton, CA compared to nearest cities:
(Note: Based on data for the last 3 years, including only cities with population 5,000 and above)
| Stockton: | 104.6 |
| Lodi: | 46.5 |
| Lathrop: | 70.6 |
| Manteca: | 59.8 |
| Thornton: | 22.6 |
| Discovery Bay: | 23.6 |
| Tracy: | 35.8 |
| Mountain House: | 3.8 |
| Ripon: | 46.5 |
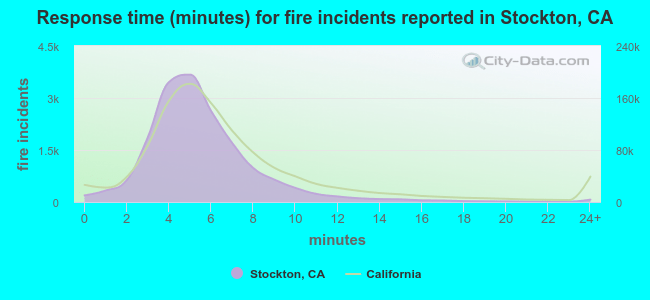 The median response time based on all reported fire incidents is 5 minutes. This is lower than the state median value.
The median response time in Stockton, CA compared to nearest cities:
(Note: Based on data for all years, including only cities with at least 500 fire incidents)
| Stockton: | 5 minutes |
| Lodi: | 5 minutes |
| Lathrop: | 6 minutes |
| Linden: | 8 minutes |
| Manteca: | 5 minutes |
| Thornton: | 6 minutes |
| Tracy: | 7 minutes |
| Ripon: | 6 minutes |
| Brentwood: | 7 minutes |
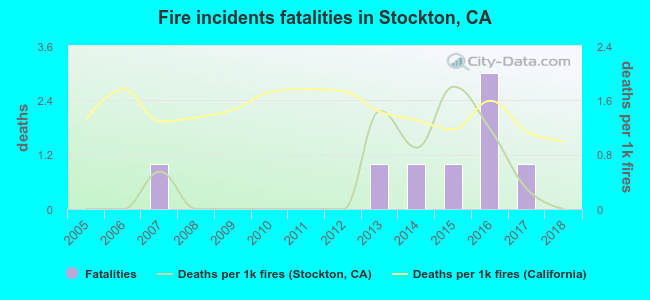 Based on the reports from the years 2005 - 2018 the average number of fire-related fatalities per year is 1. The highest number of deaths - 3 took place in 2016, and the lowest - 0 in 2005. The data has a constant trend.
The average number of fatalities per 1,000 fires is 0. This indicator was the highest - 2 in 2015, and the lowest 0 in 2005. The trend for fatalities per 1,000 fires is constant. Compared to the California value the number of fatalities per 1,000 fires is much lower.
Based on the reports from the years 2005 - 2018 the average number of fire-related fatalities per year is 1. The highest number of deaths - 3 took place in 2016, and the lowest - 0 in 2005. The data has a constant trend.
The average number of fatalities per 1,000 fires is 0. This indicator was the highest - 2 in 2015, and the lowest 0 in 2005. The trend for fatalities per 1,000 fires is constant. Compared to the California value the number of fatalities per 1,000 fires is much lower.
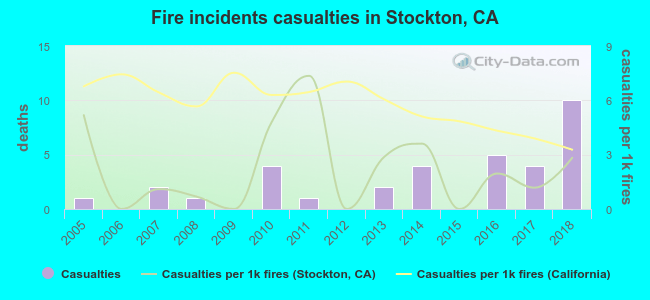 According to the reports from the years 2005 - 2018 the average number of fire-related casualties per year is 2. The highest number of injuries - 10 took place in 2018, and the lowest - 0 in 2006. The data has an increasing trend.
The average number of injuries per 1,000 fire incidents is 2. This indicator was the highest - 7 in 2011, and the lowest 0 in 2006. The trend for injuries per 1,000 fires is decreasing. Compared to the California value the number of injuries per 1,000 fire incidents is much lower.
According to the reports from the years 2005 - 2018 the average number of fire-related casualties per year is 2. The highest number of injuries - 10 took place in 2018, and the lowest - 0 in 2006. The data has an increasing trend.
The average number of injuries per 1,000 fire incidents is 2. This indicator was the highest - 7 in 2011, and the lowest 0 in 2006. The trend for injuries per 1,000 fires is decreasing. Compared to the California value the number of injuries per 1,000 fire incidents is much lower.
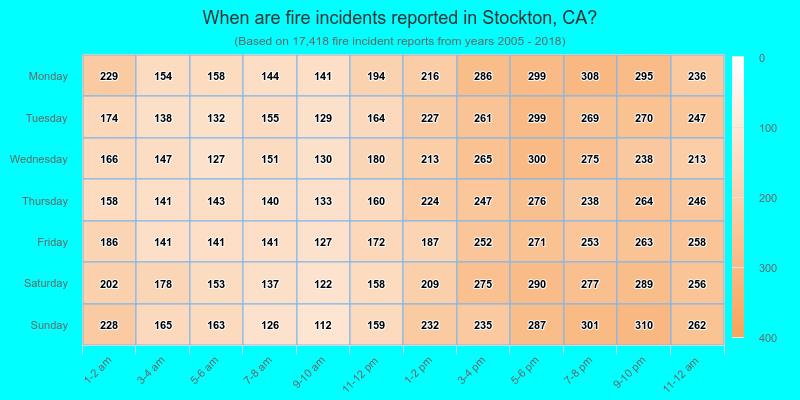
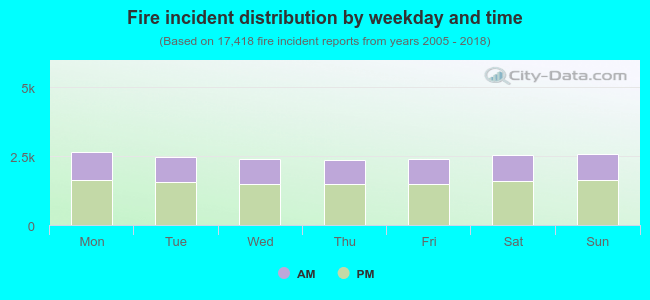 37.3% incidents where reported in the morning and 62.7% in the evening. The most fires (15.3%) took place on Monday, and the least (13.6%) on Thursday.
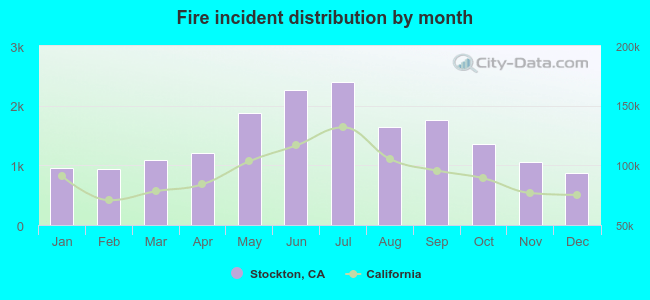 According to the 17,418 incident reports from years 2005 - 2018 most fires (13.7%) took place during July, and the least (5.0%) in December.
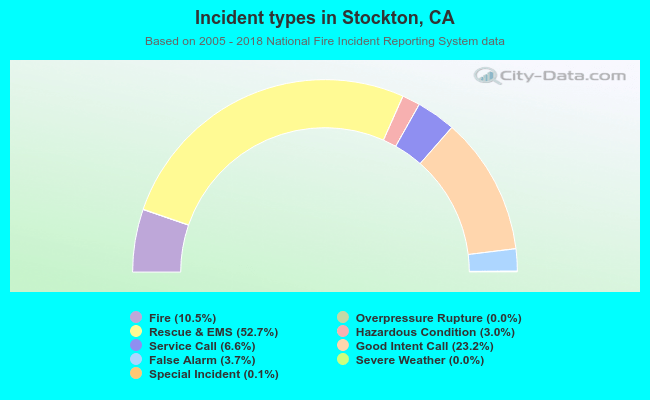 Out of all 165,206 cases reported during the years 2005 - 2018, the most belonged to the categories: Rescue & EMS (52.7%), Good Intent Call (23.2%), and Fire (10.5%).
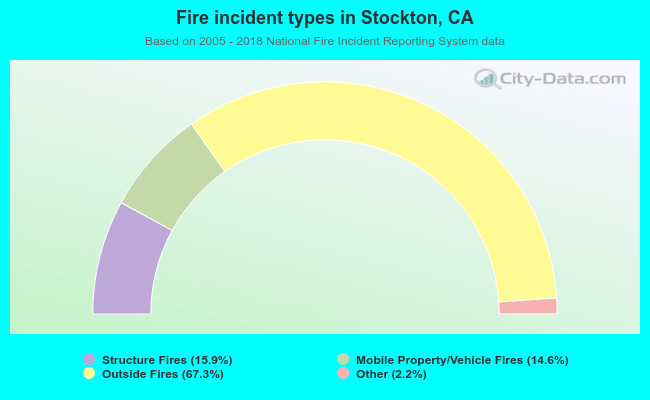 When looking into fire subcategories, the most reports belonged to: Outside Fires (67.3%), and Structure Fires (15.9%).