Stinnett: Fire Incidents, Texas (TX)
Where are fire incidents reported in Stinnett, TX
Something went wrong! Please refresh the page.
|
| |||||||||||||||||||||||||||||||||||||||||||||||||||||||||||||||||||||||||||||||||||||||||||||||||||||||||||||
2003 - 2018 National Fire Incident Reporting System (NFIRS) incidents
- Incident types reported to NFIRS in Stinnett, TX
- 46566.6%Fire
- 11216.0%Hazardous Condition
- 7711.0%Good Intent Call
- 294.2%Rescue & EMS
- 101.4%Service Call
- 30.4%False Alarm
- 10.1%Overpressure Rupture
- 10.1%Severe Weather
- Fire incident types reported to NFIRS in Stinnett, TX
- 36879.1%Outside Fires
- 5411.6%Structure Fires
- 367.7%Mobile Property/Vehicle Fires
- 71.5%Other
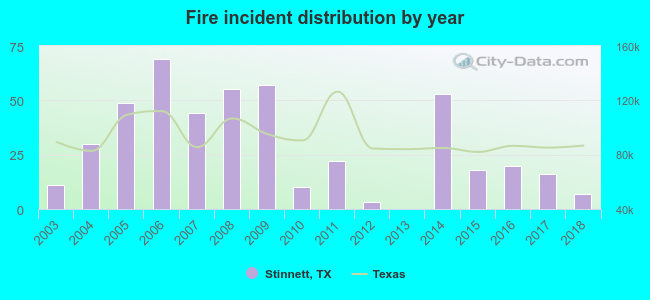 According to the data from the years 2003 - 2018 the average number of fires per year is 29. The highest number of fires - 69 took place in 2006, and the least - 0 in 2013. The data has a declining trend.
 24.7% incidents where reported in the morning and 75.3% in the evening. The most fires (16.8%) took place on Monday, and the least (12.5%) on Wednesday.
 According to the 465 incident reports from years 2003 - 2018 most fires (12.5%) took place during January, and the least (4.5%) in September.
 Out of all 698 cases reported during the years 2003 - 2018, the most belonged to the categories: Fire (66.6%), Hazardous Condition (16.0%), and Good Intent Call (11.0%).
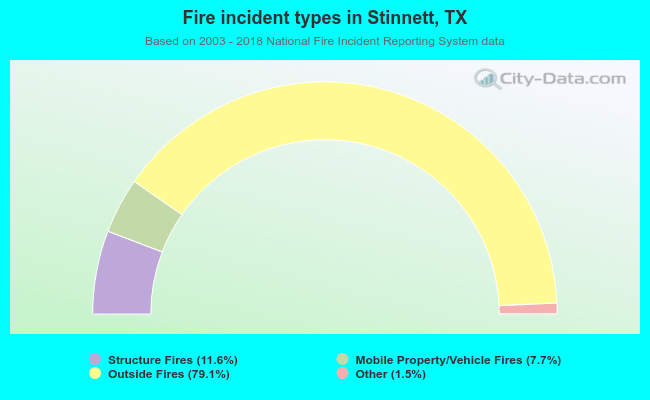 When looking into fire subcategories, the most incidents belonged to: Outside Fires (79.1%), and Structure Fires (11.6%).