Spring Hill: Fire Incidents, Florida (FL)
Where are fire incidents reported in Spring Hill, FL
Something went wrong! Please refresh the page.
| Fire incidents reported | |
|---|---|
| Sreet name | Count |
| SPRING HILL DR | 112 |
| MARINER BLVD | 102 |
| COMMERCIAL WAY | 98 |
| CORTEZ BLVD | 84 |
| SHADY HILLS RD | 60 |
| COUNTY LINE RD | 56 |
| DELTONA BLVD | 38 |
| HAYS RD | 34 |
| SHOAL LINE BLVD | 34 |
| PEACE BLVD | 22 |
| PINEHURST DR | 22 |
| PLATINUM DR | 22 |
| ELGIN BLVD | 20 |
| MONTEVERDE DR | 20 |
| ALEXSON ST | 18 |
| ANDERSON SNOW RD | 18 |
| GODFREY AVE | 18 |
| FOREST OAKS BLVD | 16 |
| LANDOVER BLVD | 16 |
| SIAM DR | 16 |
| AKINS DR | 14 |
| BARCLAY AVE | 14 |
| CENTURY DR | 14 |
| OMAHA CIR | 14 |
| SUNCOAST PKY | 14 |
| WELLBORN LN | 14 |
| DALBERG DR | 12 |
| ELWOOD RD | 12 |
| GREENSBORO ST | 12 |
| HIGHGROVE RD | 12 |
| Other | 947 |
2002 - 2018 National Fire Incident Reporting System (NFIRS) incidents
- Incident types reported to NFIRS in Spring Hill, FL
- 27,71369.7%Rescue & EMS
- 5,17313.0%Service Call
- 2,7707.0%Good Intent Call
- 1,9054.8%Fire
- 1,1953.0%False Alarm
- 9522.4%Hazardous Condition
- Fire incident types reported to NFIRS in Spring Hill, FL
- 88346.4%Outside Fires
- 59331.1%Structure Fires
- 31716.6%Mobile Property/Vehicle Fires
- 1125.9%Other
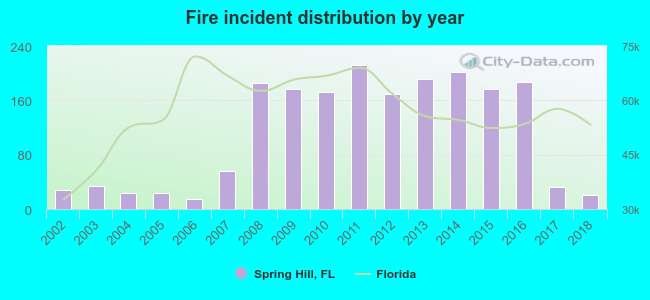 Based on the data from the years 2002 - 2018 the average number of fire incidents per year is 112. The highest number of fires - 212 took place in 2011, and the least - 14 in 2006. The data has a dropping trend.
The average number of yearly fire incidents per 10k residents in Spring Hill, FL compared to nearest cities:
(Note: Based on data for the last 3 years, including only cities with population 5,000 and above)
| Spring Hill: | 8.1 |
| Shady Hills: | 5.6 |
| Brooksville: | 246.9 |
| Hudson: | 95.7 |
| Bayonet Point: | 9.9 |
| New Port Richey: | 151.1 |
| Odessa: | 19.3 |
| Trinity: | 3.7 |
| Dade City: | 135.8 |
 The median response time based on all reported fire incidents is 7 minutes. This is close to the state median value.
The median response time in Spring Hill, FL compared to nearest cities:
(Note: Based on data for all years, including only cities with at least 500 fire incidents)
| Spring Hill: | 7 minutes |
| Brooksville: | 7 minutes |
| Hudson: | 8 minutes |
| Port Richey: | 5 minutes |
| New Port Richey: | 6 minutes |
| Homosassa: | 9 minutes |
| Dade City: | 7 minutes |
| Holiday: | 6 minutes |
| Wesley Chapel: | 8 minutes |
 According to the data from the years 2002 - 2018 the average number of fire-related yearly deaths is 0. The highest number of reported deaths - 2 took place in 2010, and the lowest - 0 in 2002. The data has a constant trend.
 According to the reports from the years 2002 - 2018 the average number of fire-related casualties per year is 2. The highest number of reported injuries - 10 took place in 2014, and the lowest - 0 in 2003. The data has a declining trend.
The average number of injuries per 1,000 fires is 16. This indicator was the highest - 71 in 2002, and the lowest 0 in 2003. The trend for casualties per 1,000 fire incidents is declining. Compared to the Florida value the number of casualties per 1,000 fire incidents is higher.
According to the reports from the years 2002 - 2018 the average number of fire-related casualties per year is 2. The highest number of reported injuries - 10 took place in 2014, and the lowest - 0 in 2003. The data has a declining trend.
The average number of injuries per 1,000 fires is 16. This indicator was the highest - 71 in 2002, and the lowest 0 in 2003. The trend for casualties per 1,000 fire incidents is declining. Compared to the Florida value the number of casualties per 1,000 fire incidents is higher.Casualties per 1,000 incidents in Spring Hill, FL compared to nearest cities:
(Note: Based on data for all years, including only cities with at least 500 fire incidents)
| Spring Hill: | 21.0 |
| Brooksville: | 17.4 |
| Hudson: | 25.8 |
| Port Richey: | 17.5 |
| New Port Richey: | 25.6 |
| Homosassa: | 14.8 |
| Dade City: | 10.3 |
| Holiday: | 46.5 |
| Wesley Chapel: | 28.4 |
 26.7% incidents where reported in the morning and 73.3% in the evening. The most fires (16.7%) took place on Saturday, and the least (12.2%) on Thursday.
 According to the 1,905 fires from years 2002 - 2018 most fires (11.2%) took place during May, and the least (6.2%) in November.
 Out of all 39,766 cases reported during the years 2002 - 2018, the most belonged to the categories: Rescue & EMS (69.7%), Service Call (13.0%), and Good Intent Call (7.0%).
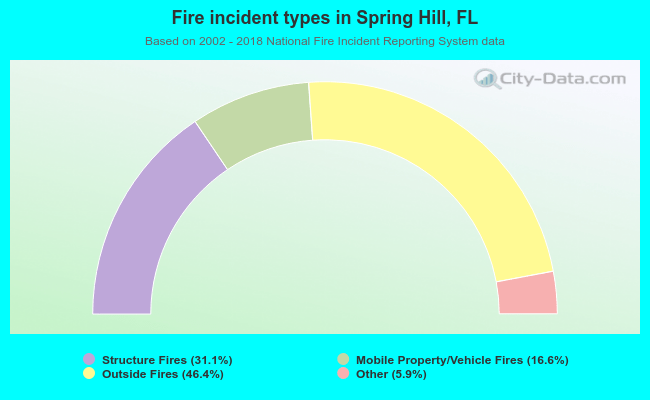 When looking into fire subcategories, the most reports belonged to: Outside Fires (46.4%), and Structure Fires (31.1%).