Spokane: Fire Incidents, Washington (WA)
Where are fire incidents reported in Spokane, WA
Something went wrong! Please refresh the page.
| Fire incidents reported | |
|---|---|
| Sreet name | Count |
| SPRAGUE AVE | 392 |
| DIVISION ST | 248 |
| SPRAGUE AVE. | 244 |
| UPRIVER DR | 230 |
| TRENT AVE. | 178 |
| 3RD AVE | 156 |
| WELLESLEY AVE | 150 |
| 2ND AVE | 146 |
| BROADWAY AVE. | 146 |
| HAWTHORNE RD | 144 |
| MARKET ST | 136 |
| TRENT AVE | 134 |
| 4TH AVE. | 132 |
| MISSION AVE | 126 |
| SULLIVAN RD. | 122 |
| BOONE AVE | 120 |
| BROADWAY AVE | 118 |
| 5TH AVE | 116 |
| MISSION AVE. | 116 |
| FRANCIS AVE | 114 |
| GEIGER BLVD | 112 |
| EUCLID AVE | 106 |
| I90 EAST | 106 |
| 8TH AVE | 104 |
| I90 WEST | 104 |
| RIVERSIDE AVE | 100 |
| MONROE ST | 96 |
| PACIFIC AVE | 96 |
| 1ST AVE | 94 |
| 4TH AVE | 92 |
| Other | 7,074 |
2002 - 2018 National Fire Incident Reporting System (NFIRS) incidents
- Incident types reported to NFIRS in Spokane, WA
- 132,95466.2%Rescue & EMS
- 23,98311.9%Good Intent Call
- 15,9257.9%Service Call
- 11,3525.7%Fire
- 7,9484.0%False Alarm
- 7,3713.7%Hazardous Condition
- 1,0870.5%Special Incident
- 2060.1%Overpressure Rupture
- Fire incident types reported to NFIRS in Spokane, WA
- 5,21746.0%Outside Fires
- 3,71132.7%Structure Fires
- 1,68814.9%Mobile Property/Vehicle Fires
- 7366.5%Other
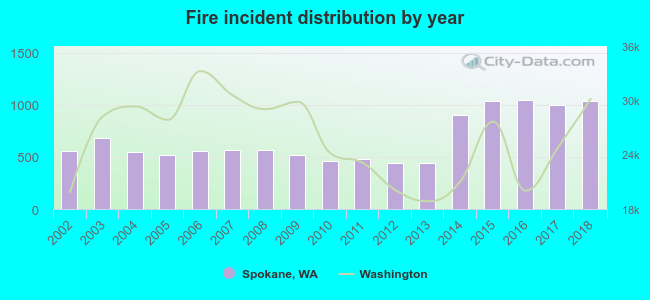 According to the data from the years 2002 - 2018 the average number of fire incidents per year is 668. The highest number of fires - 1,043 took place in 2016, and the least - 438 in 2013. The data has a rising trend.
The average number of yearly fire incidents per 10k residents in Spokane, WA compared to nearest cities:
(Note: Based on data for the last 3 years, including only cities with population 5,000 and above)
| Spokane: | 48.3 |
| Mead: | 13.3 |
| Spokane Valley: | 34.0 |
| Airway Heights: | 76.4 |
| Veradale: | 2.0 |
| Cheney: | 72.1 |
| Liberty Lake: | 22.4 |
| Colbert: | 10.8 |
| Loon Lake: | 15.7 |
 The median response time based on all reported fire incidents is 6 minutes. This is close to the state median value.
The median response time in Spokane, WA compared to nearest cities:
(Note: Based on data for all years, including only cities with at least 500 fire incidents)
| Spokane: | 6 minutes |
| Spokane Valley: | 6 minutes |
| Airway Heights: | 6 minutes |
| Medical Lake: | 12 minutes |
| Cheney: | 6 minutes |
| Deer Park: | 10 minutes |
| Post Falls: | 7 minutes |
| Rathdrum: | 10 minutes |
| Coeur d'Alene: | 6 minutes |
 According to the data from the years 2002 - 2018 the average number of fire-related fatalities per year is 2. The highest number of deaths - 4 took place in 2016, and the lowest - 0 in 2003. The data has a growing trend.
The average number of fatalities per 1,000 fire incidents is 2. This indicator was the highest - 7 in 2010, and the lowest 0 in 2003. The trend for fatalities per 1,000 fire incidents is rising. Compared to the Washington value the number of deaths per 1,000 fires is higher.
According to the data from the years 2002 - 2018 the average number of fire-related fatalities per year is 2. The highest number of deaths - 4 took place in 2016, and the lowest - 0 in 2003. The data has a growing trend.
The average number of fatalities per 1,000 fire incidents is 2. This indicator was the highest - 7 in 2010, and the lowest 0 in 2003. The trend for fatalities per 1,000 fire incidents is rising. Compared to the Washington value the number of deaths per 1,000 fires is higher.Deaths per 1,000 incidents in Spokane, WA compared to nearest cities:
(Note: Based on data for all years, including only cities with at least 2,500 fire incidents)
| Spokane: | 2.5 |
 Based on the reports from the years 2002 - 2018 the average number of fire-related casualties per year is 9. The highest number of reported injuries - 21 took place in 2016, and the lowest - 0 in 2006. The data has an increasing trend.
The average number of casualties per 1,000 fire incidents is 12. This indicator was the highest - 27 in 2013, and the lowest 0 in 2006. The trend for casualties per 1,000 fire incidents is increasing. Compared to the state value the number of injuries per 1,000 incidents is higher.
Based on the reports from the years 2002 - 2018 the average number of fire-related casualties per year is 9. The highest number of reported injuries - 21 took place in 2016, and the lowest - 0 in 2006. The data has an increasing trend.
The average number of casualties per 1,000 fire incidents is 12. This indicator was the highest - 27 in 2013, and the lowest 0 in 2006. The trend for casualties per 1,000 fire incidents is increasing. Compared to the state value the number of injuries per 1,000 incidents is higher.Casualties per 1,000 incidents in Spokane, WA compared to nearest cities:
(Note: Based on data for all years, including only cities with at least 500 fire incidents)
| Spokane: | 12.9 |
| Spokane Valley: | 15.1 |
| Airway Heights: | 7.7 |
| Medical Lake: | 2.5 |
| Cheney: | 10.0 |
| Deer Park: | 1.9 |
| Post Falls: | 18.9 |
| Rathdrum: | 3.4 |
| Coeur d'Alene: | 8.6 |
 33.2% incidents where reported in the morning and 66.8% in the evening. The most fires (15.3%) took place on Saturday, and the least (13.6%) on Wednesday.
 According to the 11,352 fire incidents from years 2002 - 2018 most fires (14.8%) took place during July, and the least (5.2%) in January.
 Out of all 200,847 cases reported during the years 2002 - 2018, the most belonged to the categories: Rescue & EMS (66.2%), Good Intent Call (11.9%), and Service Call (7.9%).
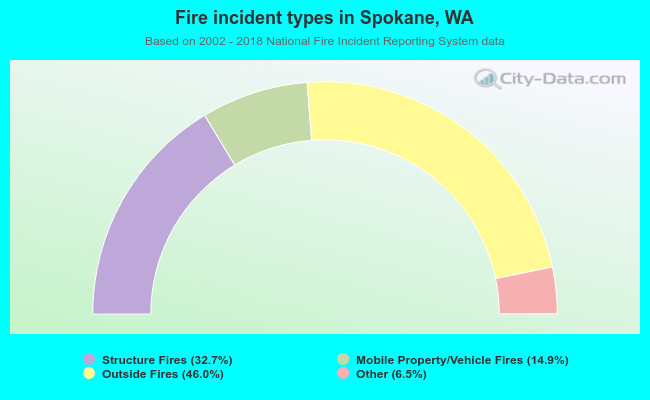 When looking into fire subcategories, the most reports belonged to: Outside Fires (46.0%), and Structure Fires (32.7%).