Somerville: Fire Incidents, Tennessee (TN)
Where are fire incidents reported in Somerville, TN
Something went wrong! Please refresh the page.
|
| |||||||||||||||||||||||||||||||||||||||||||||||||||||||||||||||||||||||||||||||||||||||||||||||||||||||||||||
| Other | 598 | |||||||||||||||||||||||||||||||||||||||||||||||||||||||||||||||||||||||||||||||||||||||||||||||||||||||||||||
2002 - 2018 National Fire Incident Reporting System (NFIRS) incidents
- Incident types reported to NFIRS in Somerville, TN
- 3,90956.4%Rescue & EMS
- 1,53422.1%Fire
- 5998.6%Good Intent Call
- 3394.9%False Alarm
- 3354.8%Hazardous Condition
- 1942.8%Service Call
- 150.2%Severe Weather
- Fire incident types reported to NFIRS in Somerville, TN
- 70445.9%Structure Fires
- 61840.3%Outside Fires
- 20013.0%Mobile Property/Vehicle Fires
- 120.8%Other
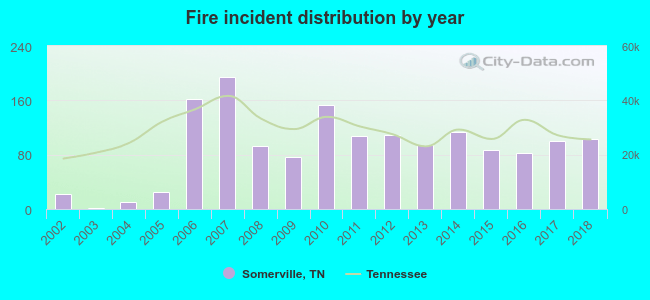 According to the data from the years 2002 - 2018 the average number of fire incidents per year is 90. The highest number of reported fire incidents - 195 took place in 2007, and the least - 2 in 2003. The data has a rising trend.
 The median response time based on all reported fire incidents is 9 minutes. This is higher compared to the Tennessee median value.
The median response time in Somerville, TN compared to nearest cities:
(Note: Based on data for all years, including only cities with at least 500 fire incidents)
| Somerville: | 9 minutes |
| Oakland: | 8 minutes |
| Moscow: | 13 minutes |
| Arlington: | 6 minutes |
| Bolivar: | 4 minutes |
| Collierville: | 5 minutes |
| Brownsville: | 8 minutes |
| Brighton: | 9 minutes |
| Germantown: | 5 minutes |
 29.1% incidents where reported in the morning and 70.9% in the evening. The most fires (16.0%) took place on Saturday, and the least (12.9%) on Tuesday.
 According to the 1,534 incident reports from years 2002 - 2018 most fires (12.8%) took place during January, and the least (5.3%) in May.
 Out of all 6,931 cases reported during the years 2002 - 2018, the most belonged to the categories: Rescue & EMS (56.4%), Fire (22.1%), and Good Intent Call (8.6%).
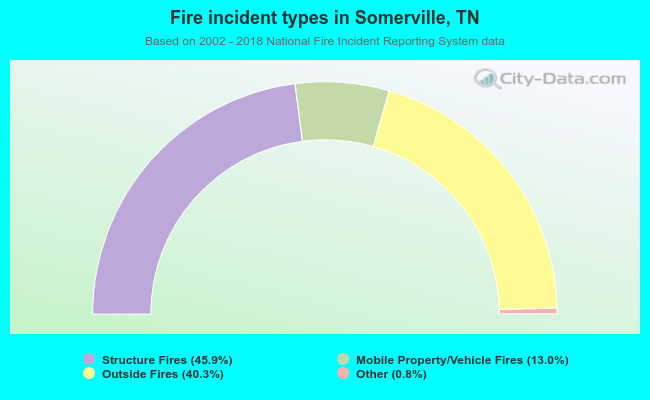 When looking into fire subcategories, the most incidents belonged to: Structure Fires (45.9%), and Outside Fires (40.3%).