Shongaloo: Fire Incidents, Louisiana (LA)
Where are fire incidents reported in Shongaloo, LA
Something went wrong! Please refresh the page.
|
| |||||||||||||||||||||||||||||||||||||||||||||||||||||||||||||||||||||||||||||||||||||||||||||||||||||||||||||
2002 - 2017 National Fire Incident Reporting System (NFIRS) incidents
- Incident types reported to NFIRS in Shongaloo, LA
- 22542.9%Rescue & EMS
- 20639.2%Fire
- 6612.6%Service Call
- 112.1%False Alarm
- 81.5%Hazardous Condition
- 71.3%Good Intent Call
- 20.4%Severe Weather
- Fire incident types reported to NFIRS in Shongaloo, LA
- 11153.9%Outside Fires
- 8139.3%Structure Fires
- 73.4%Mobile Property/Vehicle Fires
- 73.4%Other
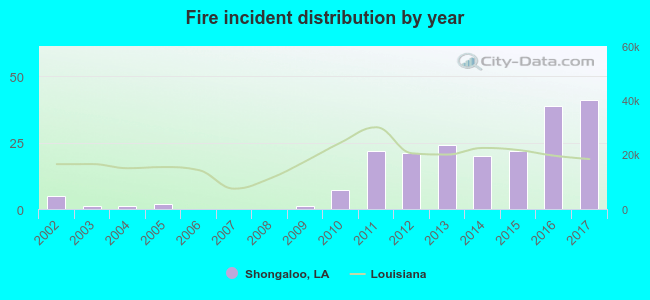 According to the data from the years 2002 - 2017 the average number of fire incidents per year is 13. The highest number of reported fires - 41 took place in 2017, and the least - 0 in 2006. The data has an increasing trend.
 23.3% incidents where reported in the morning and 76.7% in the evening. The most fires (20.4%) took place on Saturday, and the least (7.8%) on Thursday.
 Based on the 206 fire incidents from years 2002 - 2017 most fires (15.5%) took place during January, and the least (3.4%) in May.
 Out of all 525 cases reported during the years 2002 - 2017, the most belonged to the categories: Overpressure Rupture (42.9%), Fire (39.2%), and Hazardous Condition (12.6%).
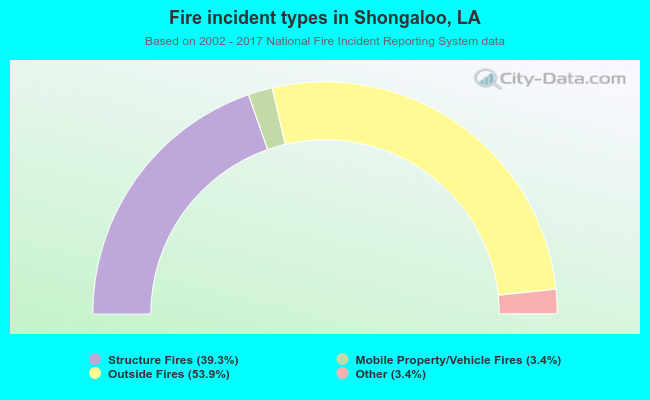 When looking into fire subcategories, the most incidents belonged to: Outside Fires (53.9%), and Structure Fires (39.3%).