| Fire incidents reported |
|---|
| Sreet name | Count |
|---|
| HWY 44 | 56 | | HWY 44 HWY | 38 | | DERSCH RD | 22 | | HIGHWAY 44 | 22 | | WILDCAT RD | 22 | | PEGNAN RD | 12 | | ROAD | 12 | | ROCK CREEK RD | 12 | | SITES RD | 12 | | STARLITE PINES RD | 12 | | ALWARD RD | 10 | | NORTHWOOD DR | 10 | | THUMPER DR | 10 | | WENGLER HILL RD | 10 | | WILSON HILL RD | 10 | | ALWARD WAY | 8 | | EMIGRANT TRL | 8 | | INWOOD RD | 8 | | PONDEROSA WAY | 8 | | WESTMOORE RD | 8 | | ASH CREEK RD | 6 | | BAMBI DR | 6 | | BOULDER RIDGE TRL | 6 | | CREEKSIDE MOBILE CIR | 6 | | LACK CREEK DR | 6 |
| | | Fire incidents reported |
|---|
| Sreet name | Count |
|---|
| STAR TREK DR | 6 | | TINKERBELL LN | 6 | | WITHROW RD | 6 | | 44 HWY | 4 | | ALPINE WAY | 4 | | BLACK BUTTE RD | 4 | | CEDAR MEADOWS LN | 4 | | CIRCLE K DR | 4 | | DEER FLAT RD | 4 | | GRACE LAKE RD | 4 | | HOBART RD | 4 | | LINDA RD | 4 | | MANTON PONDEROSA WAY | 4 | | MANTON PONDEROSA WAY | 4 | | MCCUMBER LAKE RD | 4 | | MILL CREEK | 4 | | MOBILE PARK DR | 4 | | MOORERION | 4 | | MOUNTAIN MEADOW RD | 4 | | PONDEROSA | 4 | | PONDEROSA WAY | 4 | | RINGTAIL LN | 4 | | SAVANNAH WAY | 4 | | SHINGLE GLEN TRL | 4 | | |
|
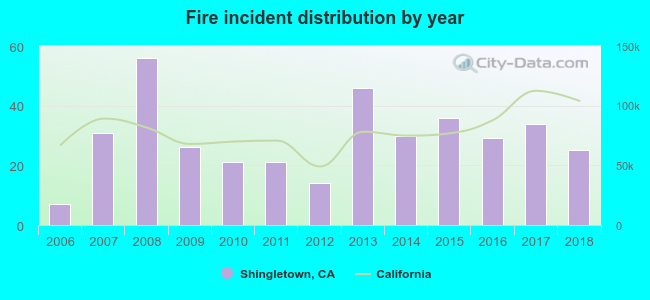 Based on the data from the years 2006 - 2018 the average number of fire incidents per year is 29. The highest number of reported fire incidents - 56 took place in 2008, and the least - 7 in 2006. The data has a rising trend.
 38.0% incidents where reported in the morning and 62.0% in the evening. The most fires (18.4%) took place on Monday, and the least (12.2%) on Sunday.
 Based on the 376 incident reports from years 2006 - 2018 most fires (17.0%) took place during June, and the least (3.7%) in February.
 Out of all 2,460 cases reported during the years 2006 - 2018, the most belonged to the categories: Rescue & EMS (58.0%), Fire (15.3%), and Service Call (13.6%).
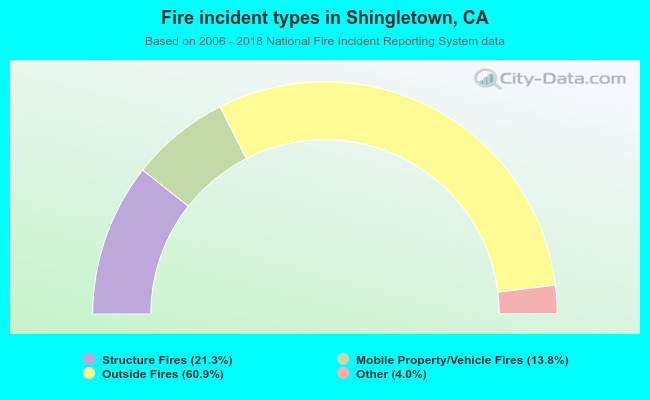 When looking into fire subcategories, the most incidents belonged to: Outside Fires (60.9%), and Structure Fires (21.3%).