| Fire incidents reported |
|---|
| Sreet name | Count |
|---|
| HWY 71 | 23 | | 16600 HWY 145 | 20 | | 1708 HWY 37 | 20 | | 3414 HWY 37 | 15 | | 489 HWY 307 | 15 | | 7717 HWY 47 | 14 | | 15765 HWY 145 | 13 | | 22006 HWY 145 | 13 | | 7660 HWY 47 | 13 | | 7755 HWY 47 | 13 | | HWY 311 | 13 | | 10085 HWY 47 | 10 | | 101 JUNIPER RD | 10 | | 12005 HWY 47 | 10 | | 12962 HWY 42 | 10 | | 130 HWY 71 | 10 | | 1432 HWY 37 | 10 | | 16600 HWY145 | 10 | | 19341 HWY 145 | 10 | | 20311 HWY 145 | 10 | | 3060 HWY 47 | 10 | | 333 MARIGOLD RD | 10 | | 3366 HWY 37 | 10 | | 3367 HWY 37 | 10 | | 349 SPRING DR. | 10 |
| | | Fire incidents reported |
|---|
| Sreet name | Count |
|---|
| 3636 HWY 311 | 10 | | 395 HWY 406 | 10 | | 4154 HWY 47 | 10 | | 4161 HWY 71 | 10 | | 4895 HWY 47 | 10 | | 500 HWY 400 | 10 | | 630 HWY 61 | 10 | | 671 HIGHWAY 46 | 10 | | 6855 HWY 47 | 10 | | 8239 HWY 47 | 10 | | 8465 HWY 47 | 10 | | 848 HWY 400 | 10 | | 8613 HWY 42 | 10 | | HWY 46 | 10 | | 14111 HWY 42 | 9 | | 565 HWY 405 | 9 | | 70 HILLSDALE DR | 9 | | 8169 HWY 47 | 9 | | STRAWBERRY ROAD | 9 | | 10 EVERGREEN RD | 8 | | 16205 HWY 42 | 8 | | 2370 SOUTH RIVER ROAD | 8 | | 245 SOUTH RIVER DRIVE | 8 | | 3260 HWY 71 | 8 | | 6000 HWY 71 | 8 |
|
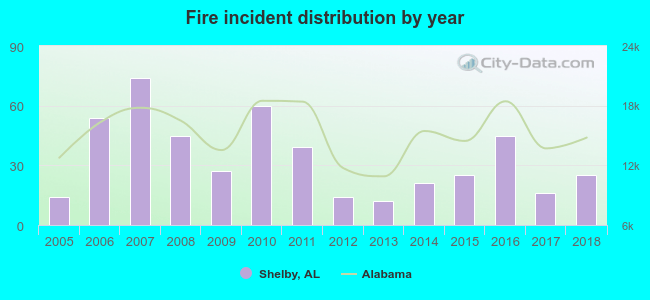 According to the data from the years 2005 - 2018 the average number of fires per year is 34. The highest number of fires - 74 took place in 2007, and the least - 12 in 2013. The data has a growing trend.
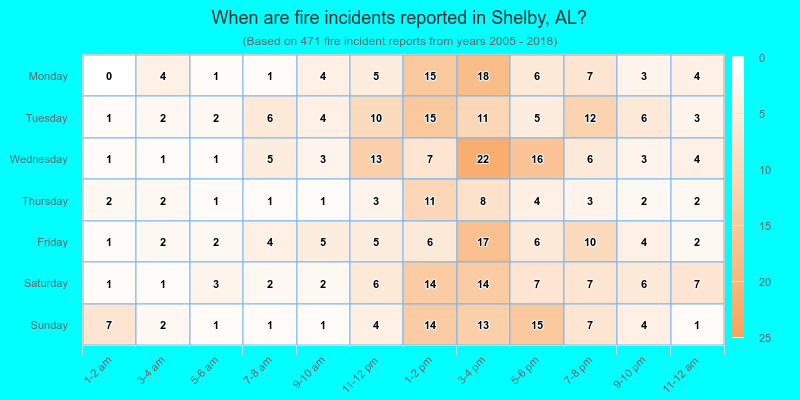
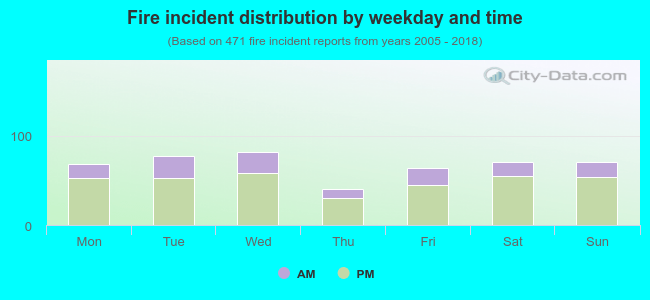 26.3% incidents where reported in the morning and 73.7% in the evening. The most fires (17.4%) took place on Wednesday, and the least (8.5%) on Thursday.
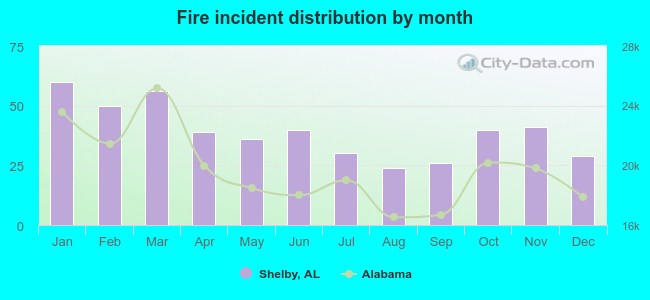 According to the 471 fire incidents from years 2005 - 2018 most fires (12.7%) took place during January, and the least (5.1%) in August.
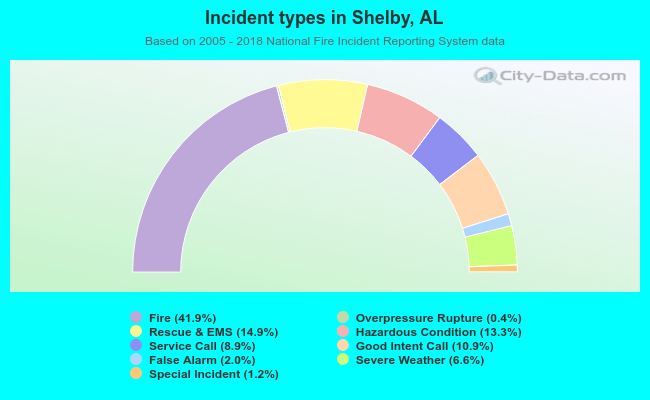 Out of all 1,124 cases reported during the years 2005 - 2018, the most belonged to the categories: Fire (41.9%), Rescue & EMS (14.9%), and Hazardous Condition (13.3%).
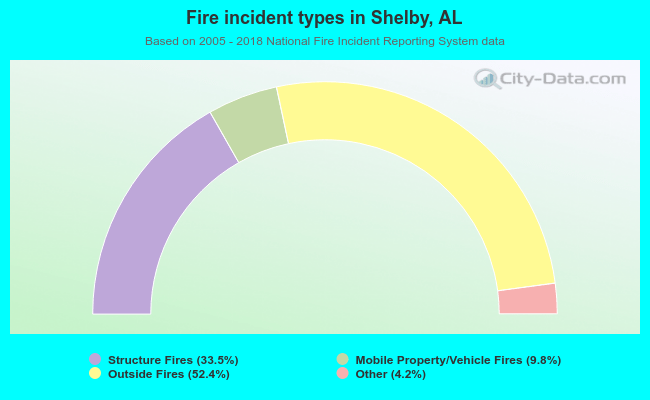 When looking into fire subcategories, the most reports belonged to: Outside Fires (52.4%), and Structure Fires (33.5%).