Seadrift: Fire Incidents, Texas (TX)
Where are fire incidents reported in Seadrift, TX
Something went wrong! Please refresh the page.
|
| |||||||||||||||||||||||||||||||||||||||||||||||||||||||||||||||||||||||||||||||||||||||||||||||||||||||||||||
| Other | 32 | |||||||||||||||||||||||||||||||||||||||||||||||||||||||||||||||||||||||||||||||||||||||||||||||||||||||||||||
2002 - 2018 National Fire Incident Reporting System (NFIRS) incidents
- Incident types reported to NFIRS in Seadrift, TX
- 44256.2%Fire
- 26433.6%Hazardous Condition
- 546.9%Good Intent Call
- 131.7%False Alarm
- 81.0%Service Call
- 50.6%Rescue & EMS
- Fire incident types reported to NFIRS in Seadrift, TX
- 30268.3%Outside Fires
- 7316.5%Structure Fires
- 419.3%Mobile Property/Vehicle Fires
- 265.9%Other
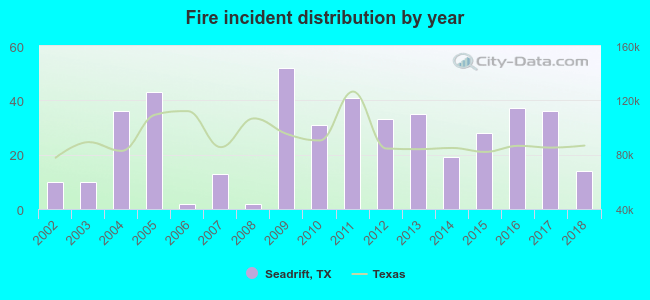 According to the data from the years 2002 - 2018 the average number of fire incidents per year is 26. The highest number of reported fire incidents - 52 took place in 2009, and the least - 2 in 2006. The data has a rising trend.
 47.5% incidents where reported in the morning and 52.5% in the evening. The most fires (18.1%) took place on Sunday, and the least (9.3%) on Wednesday.
 Based on the 442 fire incidents from years 2002 - 2018 most fires (11.5%) took place during February, and the least (4.3%) in November.
 Out of all 786 cases reported during the years 2002 - 2018, the most belonged to the categories: Fire (56.2%), Rescue & EMS (33.6%), and Service Call (6.9%).
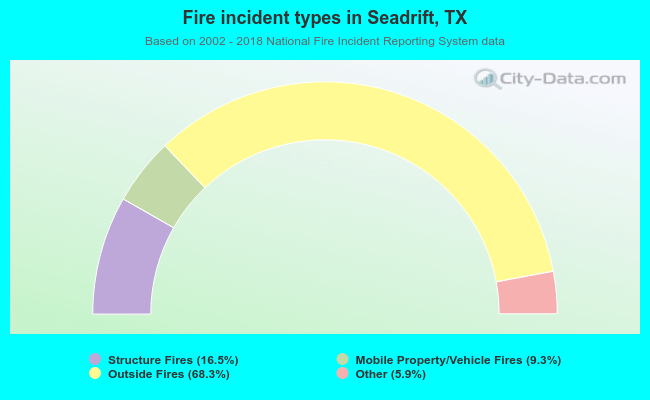 When looking into fire subcategories, the most reports belonged to: Outside Fires (68.3%), and Structure Fires (16.5%).