San Ramon: Fire Incidents, California (CA)
Where are fire incidents reported in San Ramon, CA
Something went wrong! Please refresh the page.
| Fire incidents reported | |
|---|---|
| Sreet name | Count |
| SAN RAMON VALLEY BLVD | 84 |
| ALCOSTA BLVD | 64 |
| BROADMOOR DR | 52 |
| CROW CANYON RD | 36 |
| CRESTFIELD DR | 34 |
| BOLLINGER CANYON RD | 28 |
| CANYON VILLAGE CIR | 24 |
| PINE VALLEY RD | 22 |
| CROW CANYON PL | 16 |
| I680 | 16 |
| NORRIS CANYON RD | 14 |
| REFLECTIONS CIR | 14 |
| WATERSTONE PL | 14 |
| COUNTRYBROOK LOOP | 12 |
| GALE RIDGE RD | 12 |
| MARSH DR | 12 |
| MARKET PL | 10 |
| SOMBRERO CIR | 10 |
| ALBION RD | 8 |
| CEDAR POINTE LOOP | 8 |
| EASTRIDGE DR | 8 |
| IVY HILL WAY | 8 |
| PARK PL | 8 |
| REFLECTIONS DR | 8 |
| ROSINCRESS DR | 8 |
| SB 680 NO CROW CANYON | 8 |
| WATERMILL RD | 8 |
| AVOCADO CT | 6 |
| BASSWOOD DR | 6 |
| BELLAS ARTES CIR | 6 |
| Other | 359 |
2008 - 2018 National Fire Incident Reporting System (NFIRS) incidents
- Incident types reported to NFIRS in San Ramon, CA
- 10,80062.8%Rescue & EMS
- 1,90911.1%Good Intent Call
- 1,5729.1%Service Call
- 1,1126.5%False Alarm
- 9235.4%Fire
- 7904.6%Hazardous Condition
- 430.3%Special Incident
- 410.2%Overpressure Rupture
- Fire incident types reported to NFIRS in San Ramon, CA
- 37941.1%Outside Fires
- 35138.0%Structure Fires
- 12613.7%Mobile Property/Vehicle Fires
- 677.3%Other
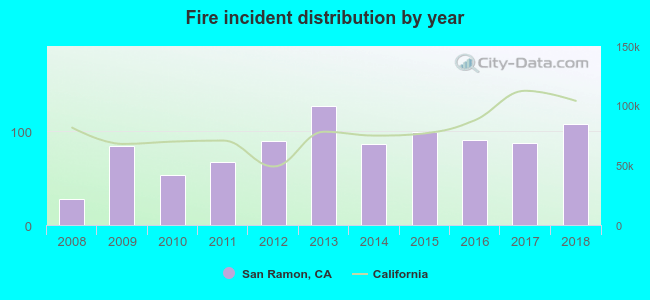 Based on the data from the years 2008 - 2018 the average number of fire incidents per year is 83. The highest number of fire incidents - 127 took place in 2013, and the least - 28 in 2008. The data has a growing trend.
The average number of yearly fire incidents per 10k residents in San Ramon, CA compared to nearest cities:
(Note: Based on data for the last 3 years, including only cities with population 5,000 and above)
| San Ramon: | 12.6 |
| Dublin: | 24.0 |
| Danville: | 11.8 |
| Blackhawk: | 9.6 |
| Pleasanton: | 20.6 |
| Castro Valley: | 14.8 |
| Alamo: | 12.1 |
| Tassajara: | 1.3 |
| Hayward: | 3.3 |
 The median response time based on all reported fire incidents is 5 minutes. This is lower than the state median value.
The median response time in San Ramon, CA compared to nearest cities:
(Note: Based on data for all years, including only cities with at least 500 fire incidents)
| San Ramon: | 5 minutes |
| Dublin: | 5 minutes |
| Danville: | 6 minutes |
| Pleasanton: | 5 minutes |
| Castro Valley: | 5 minutes |
| Hayward: | 4 minutes |
| Livermore: | 6 minutes |
| San Lorenzo: | 4 minutes |
| San Leandro: | 4 minutes |
 22.6% incidents where reported in the morning and 77.4% in the evening. The most fires (15.0%) took place on Sunday, and the least (13.3%) on Tuesday.
 According to the 923 fires from years 2008 - 2018 most fires (15.0%) took place during July, and the least (4.6%) in March.
 Out of all 17,194 cases reported during the years 2008 - 2018, the most belonged to the categories: Rescue & EMS (62.8%), Good Intent Call (11.1%), and Service Call (9.1%).
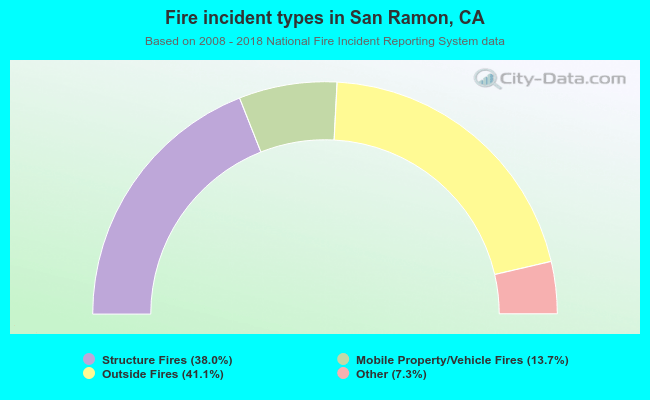 When looking into fire subcategories, the most incidents belonged to: Outside Fires (41.1%), and Structure Fires (38.0%).