Sammamish: Fire Incidents, Washington (WA)
Where are fire incidents reported in Sammamish, WA
Something went wrong! Please refresh the page.
| Fire incidents reported | |
|---|---|
| Sreet name | Count |
| 228TH AVE | 176 |
| LAKE SAMMAMISH PKY | 54 |
| INGLEWOOD HILL RD | 42 |
| BEAVER LAKE DR | 40 |
| 8TH ST | 30 |
| 211TH AVE | 24 |
| 16TH ST | 22 |
| 14TH ST | 20 |
| 24TH ST | 20 |
| 30TH ST | 20 |
| 32ND ST | 20 |
| 29TH ST | 18 |
| KLAHANIE DR | 18 |
| KLAHANIE BLVD | 16 |
| TROSSACHS BLVD | 16 |
| 218TH AVE | 14 |
| 222ND AVE | 14 |
| 27TH ST | 14 |
| 20TH ST | 12 |
| 244TH AVE | 12 |
| 4TH ST | 12 |
| ISSAQUAH-PINE LAKE RD | 12 |
| 13TH PL | 10 |
| 212TH AVE | 10 |
| 230TH LN | 10 |
| 231ST LN | 10 |
| 233RD AVE | 10 |
| 233RD PL | 10 |
| 240TH WAY | 10 |
| 243RD PL | 10 |
| Other | 142 |
2002 - 2018 National Fire Incident Reporting System (NFIRS) incidents
- Incident types reported to NFIRS in Sammamish, WA
- 8,62561.4%Rescue & EMS
- 1,64211.7%Good Intent Call
- 1,42010.1%False Alarm
- 8486.0%Fire
- 7915.6%Service Call
- 6524.6%Hazardous Condition
- 270.2%Special Incident
- 190.1%Overpressure Rupture
- 160.1%Severe Weather
- Fire incident types reported to NFIRS in Sammamish, WA
- 38645.5%Structure Fires
- 29534.8%Outside Fires
- 8910.5%Other
- 789.2%Mobile Property/Vehicle Fires
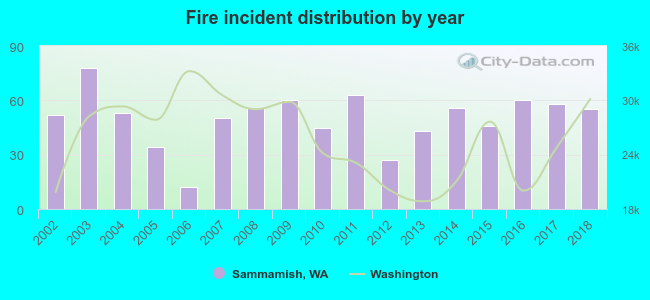 Based on the data from the years 2002 - 2018 the average number of fires per year is 50. The highest number of reported fires - 78 took place in 2003, and the least - 12 in 2006. The data has a rising trend.
The average number of yearly fire incidents per 10k residents in Sammamish, WA compared to nearest cities:
(Note: Based on data for the last 3 years, including only cities with population 5,000 and above)
| Sammamish: | 11.3 |
| Issaquah: | 26.1 |
| Bellevue: | 26.4 |
| Redmond: | 21.2 |
| Newcastle: | 17.9 |
| Kirkland: | 6.4 |
| Duvall: | 28.4 |
| Mercer Island: | 12.1 |
| Snoqualmie: | 10.0 |
 The median response time based on all reported fire incidents is 7 minutes. This is about the same as the Washington median value.
The median response time in Sammamish, WA compared to nearest cities:
(Note: Based on data for all years, including only cities with at least 500 fire incidents)
| Sammamish: | 7 minutes |
| Issaquah: | 7 minutes |
| Bellevue: | 6 minutes |
| Redmond: | 6 minutes |
| Kirkland: | 6 minutes |
| Mercer Island: | 6 minutes |
| Renton: | 6 minutes |
| Woodinville: | 7 minutes |
| Bothell: | 6 minutes |
 Based on the reports from the years 2002 - 2018 the average number of fire-related casualties per year is 0. The highest number of injuries - 2 took place in 2018, and the lowest - 0 in 2002. The data has a rising trend.
The average number of casualties per 1,000 fire incidents is 6. This indicator was the highest - 36 in 2018, and the lowest 0 in 2002. The trend for casualties per 1,000 fires is rising. Compared to the Washington value the number of casualties per 1,000 incidents is lower.
Based on the reports from the years 2002 - 2018 the average number of fire-related casualties per year is 0. The highest number of injuries - 2 took place in 2018, and the lowest - 0 in 2002. The data has a rising trend.
The average number of casualties per 1,000 fire incidents is 6. This indicator was the highest - 36 in 2018, and the lowest 0 in 2002. The trend for casualties per 1,000 fires is rising. Compared to the Washington value the number of casualties per 1,000 incidents is lower.Casualties per 1,000 incidents in Sammamish, WA compared to nearest cities:
(Note: Based on data for all years, including only cities with at least 500 fire incidents)
| Sammamish: | 5.9 |
| Issaquah: | 3.7 |
| Bellevue: | 11.9 |
| Redmond: | 7.6 |
| Kirkland: | 2.5 |
| Mercer Island: | 5.4 |
| Renton: | 17.9 |
| Woodinville: | 3.3 |
| Bothell: | 10.0 |
 31.5% incidents where reported in the morning and 68.5% in the evening. The most fires (16.9%) took place on Monday, and the least (12.3%) on Tuesday.
 Based on the 848 fire incidents from years 2002 - 2018 most fires (19.1%) took place during July, and the least (4.4%) in November.
 Out of all 14,040 cases reported during the years 2002 - 2018, the most belonged to the categories: Rescue & EMS (61.4%), Good Intent Call (11.7%), and False Alarm (10.1%).
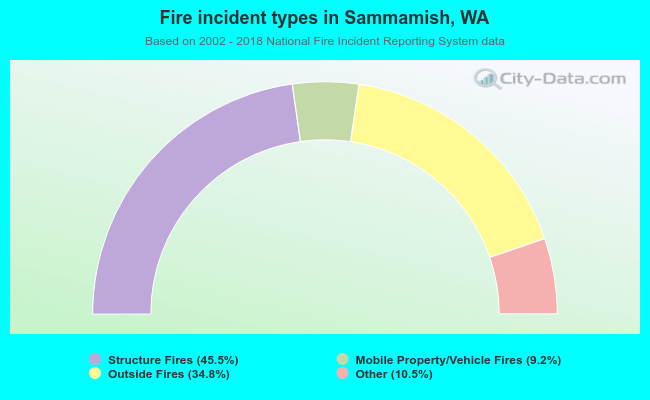 When looking into fire subcategories, the most incidents belonged to: Structure Fires (45.5%), and Outside Fires (34.8%).