Sam Rayburn: Fire Incidents, Texas (TX)
Where are fire incidents reported in Sam Rayburn, TX
Something went wrong! Please refresh the page.
|
| |||||||||||||||||||||||||||||||||||||||||||||||||||||||||||||||||||||||||||||||||||||||||||||||||||||||||||||
2003 - 2012 National Fire Incident Reporting System (NFIRS) incidents
- Incident types reported to NFIRS in Sam Rayburn, TX
- 16185.2%Fire
- 1910.1%Hazardous Condition
- 94.8%Good Intent Call
- Fire incident types reported to NFIRS in Sam Rayburn, TX
- 12275.8%Outside Fires
- 3018.6%Structure Fires
- 95.6%Mobile Property/Vehicle Fires
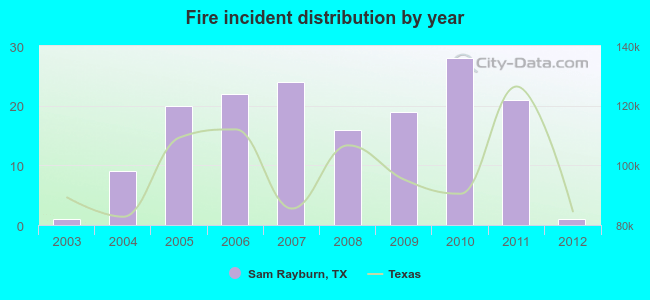 According to the data from the years 2003 - 2012 the average number of fires per year is 16. The highest number of fire incidents - 28 took place in 2010, and the least - 1 in 2003. The data has a constant trend.
 28.0% incidents where reported in the morning and 72.0% in the evening. The most fires (18.6%) took place on Thursday, and the least (12.4%) on Saturday.
 According to the 161 reports from years 2003 - 2012 most fires (16.8%) took place during August, and the least (3.1%) in February.
 Out of all 189 cases reported during the years 2003 - 2012, the most belonged to the categories: Fire (85.2%), Overpressure Rupture (10.1%), and Rescue & EMS (4.8%).
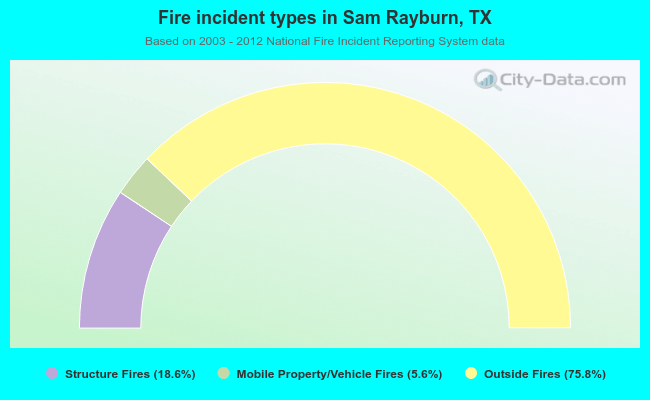 When looking into fire subcategories, the most incidents belonged to: Outside Fires (75.8%), and Structure Fires (18.6%).