Salida: Fire Incidents, California (CA)
Where are fire incidents reported in Salida, CA
Something went wrong! Please refresh the page.
|
| |||||||||||||||||||||||||||||||||||||||||||||||||||||||||||||||||||||||||||||||||||||||||||||||||||||||||||||
2005 - 2018 National Fire Incident Reporting System (NFIRS) incidents
- Incident types reported to NFIRS in Salida, CA
- 38058.0%Fire
- 11918.2%Hazardous Condition
- 7010.7%Good Intent Call
- 599.0%Rescue & EMS
- 253.8%Service Call
- 10.2%False Alarm
- 10.2%Special Incident
- Fire incident types reported to NFIRS in Salida, CA
- 17145.0%Outside Fires
- 10126.6%Structure Fires
- 9525.0%Mobile Property/Vehicle Fires
- 133.4%Other
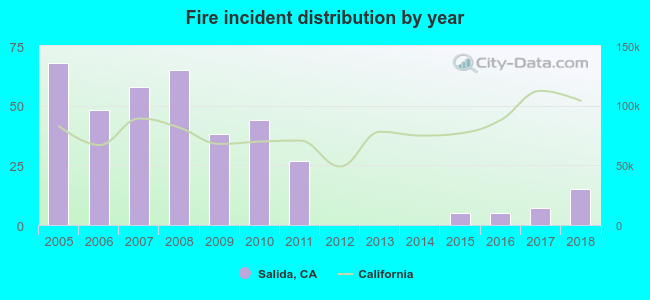 According to the data from the years 2005 - 2018 the average number of fires per year is 27. The highest number of fires - 68 took place in 2005, and the least - 0 in 2012. The data has a decreasing trend.
The average number of yearly fire incidents per 10k residents in Salida, CA compared to nearest cities:
(Note: Based on data for the last 3 years, including only cities with population 5,000 and above)
| Salida: | 6.6 |
| Ripon: | 46.5 |
| Modesto: | 68.9 |
| Escalon: | 70.4 |
| Riverbank: | 32.8 |
| Manteca: | 59.8 |
| Ceres: | 36.3 |
| Lathrop: | 70.6 |
| Oakdale: | 39.2 |
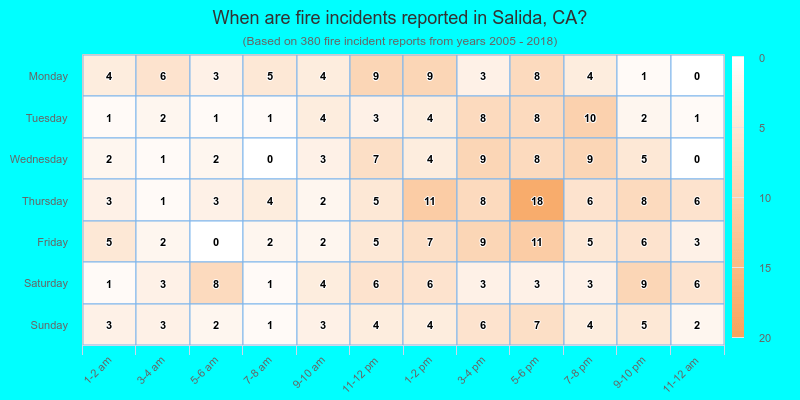
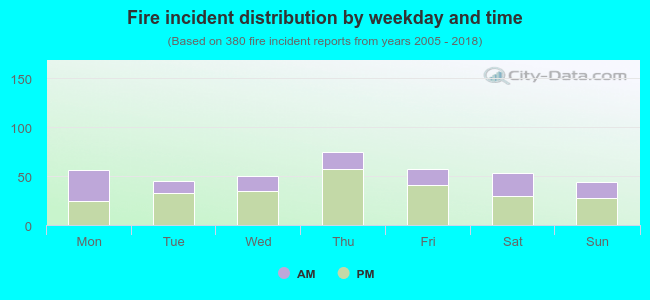 34.5% incidents where reported in the morning and 65.5% in the evening. The most fires (19.7%) took place on Thursday, and the least (11.6%) on Sunday.
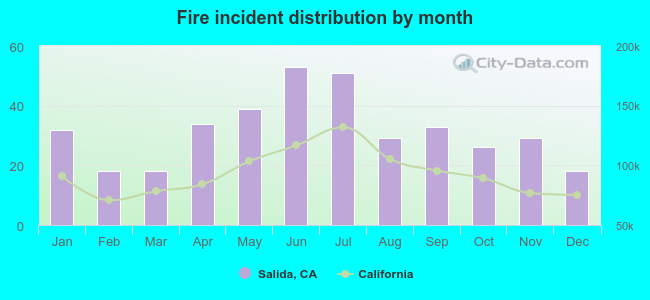 According to the 380 fires from years 2005 - 2018 most fires (13.9%) took place during June, and the least (4.7%) in February.
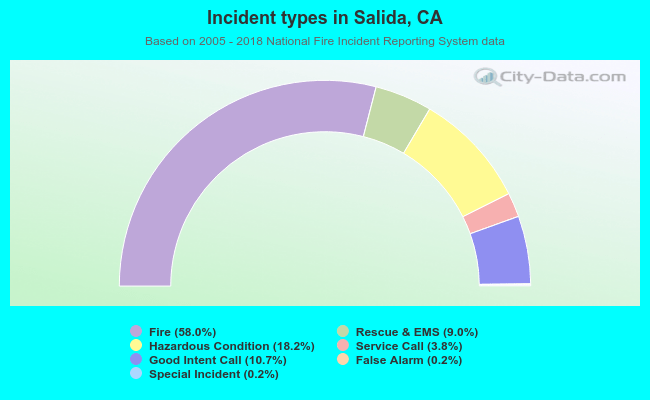 Out of all 655 cases reported during the years 2005 - 2018, the most belonged to the categories: Fire (58.0%), Rescue & EMS (18.2%), and Service Call (10.7%).
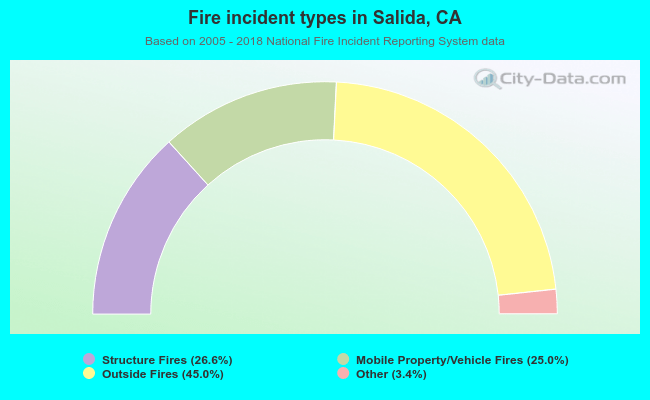 When looking into fire subcategories, the most incidents belonged to: Outside Fires (45.0%), and Structure Fires (26.6%).