Rohnert Park: Fire Incidents, California (CA)
Where are fire incidents reported in Rohnert Park, CA
Something went wrong! Please refresh the page.
|
| |||||||||||||||||||||||||||||||||||||||||||||||||||||||||||||||||||||||||||||||||||||||||||||||||||||||||||||
2005 - 2018 National Fire Incident Reporting System (NFIRS) incidents
- Incident types reported to NFIRS in Rohnert Park, CA
- 95040.4%Rescue & EMS
- 65527.8%Good Intent Call
- 45419.3%Fire
- 1375.8%Hazardous Condition
- 974.1%False Alarm
- 542.3%Service Call
- 30.1%Overpressure Rupture
- Fire incident types reported to NFIRS in Rohnert Park, CA
- 32671.8%Structure Fires
- 9320.5%Outside Fires
- 184.0%Other
- 173.7%Mobile Property/Vehicle Fires
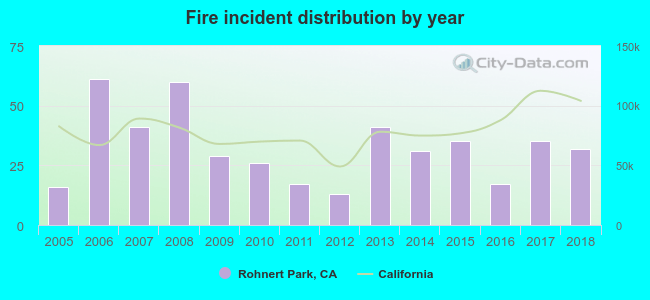 According to the data from the years 2005 - 2018 the average number of fires per year is 32. The highest number of reported fire incidents - 61 took place in 2006, and the least - 13 in 2012. The data has an increasing trend.
The average number of yearly fire incidents per 10k residents in Rohnert Park, CA compared to nearest cities:
(Note: Based on data for the last 3 years, including only cities with population 5,000 and above)
| Rohnert Park: | 6.6 |
| Cotati: | 39.0 |
| Roseland: | 18.2 |
| Santa Rosa: | 17.5 |
| Petaluma: | 19.7 |
| Sebastopol: | 88.3 |
| Boyes Hot Springs: | 3.0 |
| Sonoma: | 91.7 |
| Windsor: | 13.4 |

 34.6% incidents where reported in the morning and 65.4% in the evening. The most fires (16.5%) took place on Wednesday, and the least (12.3%) on Friday.
 Based on the 454 incident reports from years 2005 - 2018 most fires (11.9%) took place during June, and the least (5.1%) in April.
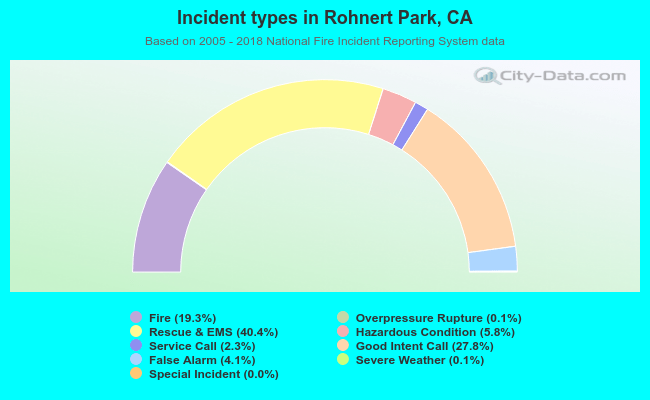 Out of all 2,353 cases reported during the years 2005 - 2018, the most belonged to the categories: Rescue & EMS (40.4%), Good Intent Call (27.8%), and Fire (19.3%).
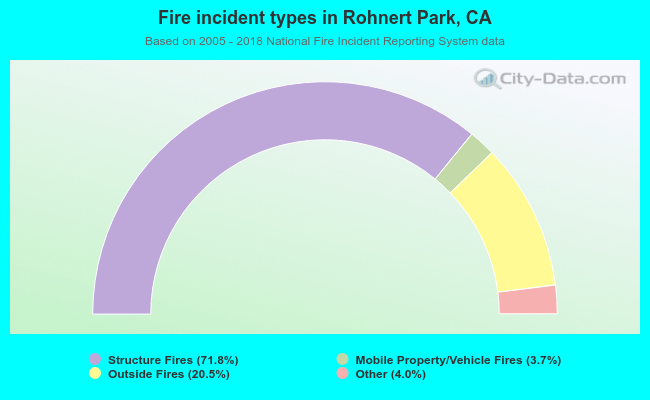 When looking into fire subcategories, the most incidents belonged to: Structure Fires (71.8%), and Outside Fires (20.5%).