Ridgefield: Fire Incidents, Connecticut (CT)
Where are fire incidents reported in Ridgefield, CT
Something went wrong! Please refresh the page.
| Fire incidents reported | |
|---|---|
| Sreet name | Count |
| DANBURY RD | 140 |
| MAIN ST | 74 |
| GILBERT ST | 68 |
| ETHAN ALLEN HWY | 52 |
| PROSPECT RDG | 40 |
| BRANCHVILLE RD | 34 |
| RIDGEBURY RD | 28 |
| BENNETTS FARM RD | 26 |
| NORTH SALEM < 288 RD | 26 |
| NORTH SALEM RD | 24 |
| CATOONAH ST | 22 |
| GOVERNOR ST | 20 |
| PROSPECT ST | 20 |
| BARRACK HILL RD | 18 |
| OLD SIB RD | 18 |
| PEACEABLE ST | 16 |
| SPRING VALLEY RD | 16 |
| WEST LA | 16 |
| WILTON RD | 16 |
| EAST RIDGE RD | 14 |
| HIGH RIDGE AVE | 14 |
| LIMESTONE RD | 14 |
| SILVER SPRING RD | 14 |
| BARLOW MTN RD | 12 |
| FARMINGVILLE RD | 12 |
| FLORIDA HILL RD | 12 |
| GREAT HILL RD | 12 |
| SOUTH ST | 12 |
| COOPER RD | 10 |
| LEDGES RD | 10 |
| Other | 88 |
2002 - 2018 National Fire Incident Reporting System (NFIRS) incidents
- Incident types reported to NFIRS in Ridgefield, CT
- 8,65749.9%Rescue & EMS
- 3,04417.6%Hazardous Condition
- 2,50614.5%False Alarm
- 1,5318.8%Service Call
- 8985.2%Fire
- 6243.6%Good Intent Call
- 350.2%Special Incident
- 220.1%Overpressure Rupture
- 210.1%Severe Weather
- Fire incident types reported to NFIRS in Ridgefield, CT
- 45550.7%Structure Fires
- 26329.3%Outside Fires
- 9410.5%Other
- 869.6%Mobile Property/Vehicle Fires
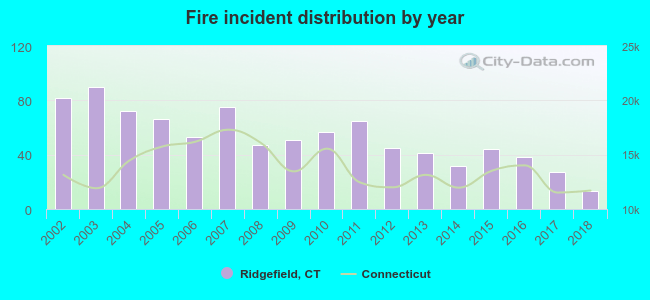 Based on the data from the years 2002 - 2018 the average number of fire incidents per year is 53. The highest number of reported fires - 90 took place in 2003, and the least - 13 in 2018. The data has a decreasing trend.
The average number of yearly fire incidents per 10k residents in Ridgefield, CT compared to nearest cities:
(Note: Based on data for the last 3 years, including only cities with population 5,000 and above)
| Ridgefield: | 34.0 |
| Redding: | 19.3 |
| Wilton: | 24.5 |
| Weston: | 20.6 |
| Bethel: | 73.3 |
| New Canaan: | 22.5 |
| Danbury: | 19.2 |
| Easton: | 34.3 |
| Westport: | 32.1 |
 The median response time based on all reported fire incidents is 6 minutes. This is close to the Connecticut median value.
The median response time in Ridgefield, CT compared to nearest cities:
(Note: Based on data for all years, including only cities with at least 500 fire incidents)
| Ridgefield: | 6 minutes |
| Redding: | 7 minutes |
| Wilton: | 6 minutes |
| Weston: | 6 minutes |
| Bethel: | 6 minutes |
| New Canaan: | 6 minutes |
| Danbury: | 5 minutes |
| Westport: | 5 minutes |
| Norwalk: | 6 minutes |
 According to the reports from the years 2002 - 2018 the average number of fire-related casualties per year is 0. The highest number of casualties - 2 took place in 2005, and the lowest - 0 in 2002. The data has a constant trend.
The average number of casualties per 1,000 fire incidents is 7. This indicator was the highest - 30 in 2005, and the lowest 0 in 2002. The trend for injuries per 1,000 fires is constant. Compared to the state value the number of casualties per 1,000 fires is lower.
According to the reports from the years 2002 - 2018 the average number of fire-related casualties per year is 0. The highest number of casualties - 2 took place in 2005, and the lowest - 0 in 2002. The data has a constant trend.
The average number of casualties per 1,000 fire incidents is 7. This indicator was the highest - 30 in 2005, and the lowest 0 in 2002. The trend for injuries per 1,000 fires is constant. Compared to the state value the number of casualties per 1,000 fires is lower.
 34.4% incidents where reported in the morning and 65.6% in the evening. The most fires (15.6%) took place on Wednesday, and the least (12.5%) on Tuesday.
 According to the 898 reports from years 2002 - 2018 most fires (10.9%) took place during November, and the least (5.9%) in August.
 Out of all 17,338 cases reported during the years 2002 - 2018, the most belonged to the categories: Rescue & EMS (49.9%), Hazardous Condition (17.6%), and False Alarm (14.5%).
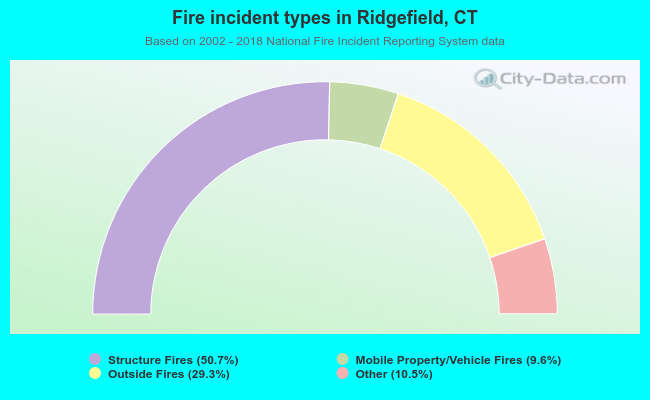 When looking into fire subcategories, the most reports belonged to: Structure Fires (50.7%), and Outside Fires (29.3%).