Redmond: Fire Incidents, Oregon (OR)
Where are fire incidents reported in Redmond, OR
Something went wrong! Please refresh the page.
| Fire incidents reported | |
|---|---|
| Sreet name | Count |
| 97 HWY | 168 |
| CANAL BLVD | 126 |
| ANTLER AVE | 116 |
| RIMROCK WAY | 90 |
| 6TH ST | 84 |
| 17TH ST | 70 |
| 126 HWY | 62 |
| HWY 97 HWY | 62 |
| CANYON DR | 60 |
| HIGHLAND AVE | 46 |
| HWY 97 | 46 |
| OBSIDIAN AVE | 40 |
| REINDEER AVE | 40 |
| 5TH ST | 38 |
| HEMLOCK AVE | 38 |
| OAK TREE LN | 38 |
| VETERANS WAY | 36 |
| 27TH ST | 34 |
| NORTHWEST WAY | 34 |
| ODEM MEDO RD | 34 |
| 19TH ST | 32 |
| 7TH ST | 32 |
| EVERGREEN AVE | 32 |
| HELMHOLTZ WAY | 32 |
| MCVEY AVE | 30 |
| SALMON AVE | 30 |
| QUARRY AVE | 28 |
| 11TH ST | 26 |
| 35TH ST | 26 |
| 4TH ST | 26 |
| Other | 383 |
2002 - 2018 National Fire Incident Reporting System (NFIRS) incidents
- Incident types reported to NFIRS in Redmond, OR
- 12,18165.8%Rescue & EMS
- 1,93910.5%Fire
- 1,88310.2%Service Call
- 1,6028.7%Good Intent Call
- 4362.4%False Alarm
- 4112.2%Hazardous Condition
- 400.2%Special Incident
- Fire incident types reported to NFIRS in Redmond, OR
- 1,21662.7%Outside Fires
- 44022.7%Structure Fires
- 24612.7%Mobile Property/Vehicle Fires
- 371.9%Other
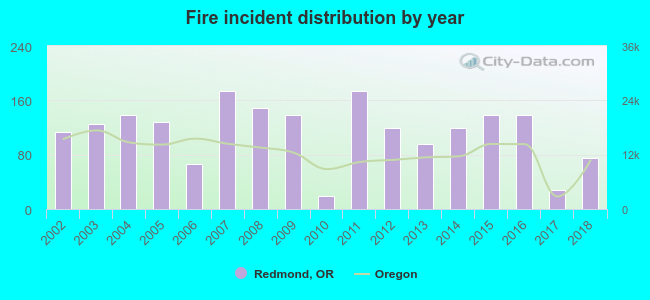 Based on the data from the years 2002 - 2018 the average number of fire incidents per year is 114. The highest number of reported fire incidents - 174 took place in 2007, and the least - 19 in 2010. The data has a decreasing trend.
The average number of yearly fire incidents per 10k residents in Redmond, OR compared to nearest cities:
(Note: Based on data for the last 3 years, including only cities with population 5,000 and above)
| Redmond: | 28.9 |
| Tumalo: | 1.4 |
| Bend: | 32.3 |
| Prineville: | 60.1 |
| Madras: | 71.9 |
| Sweet Home: | 30.3 |
| Mount Hood: | 5.2 |
| Colton: | 25.2 |
| Lebanon: | 31.7 |
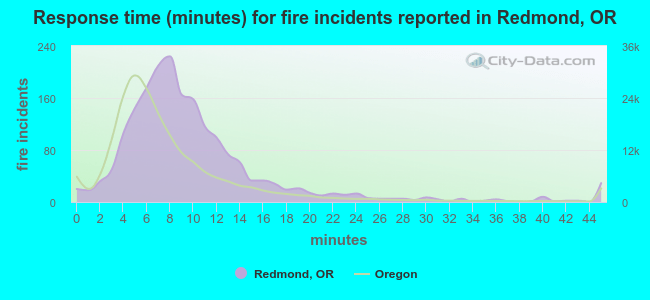 The median response time based on all reported fire incidents is 8 minutes. This is higher compared to the state median value.
The median response time in Redmond, OR compared to nearest cities:
(Note: Based on data for all years, including only cities with at least 500 fire incidents)
| Redmond: | 8 minutes |
| Bend: | 9 minutes |
| Prineville: | 9 minutes |
| Sisters: | 9 minutes |
| Madras: | 8 minutes |
| La Pine: | 12 minutes |
| Sweet Home: | 7 minutes |
| Lebanon: | 6 minutes |
| Stayton: | 8 minutes |
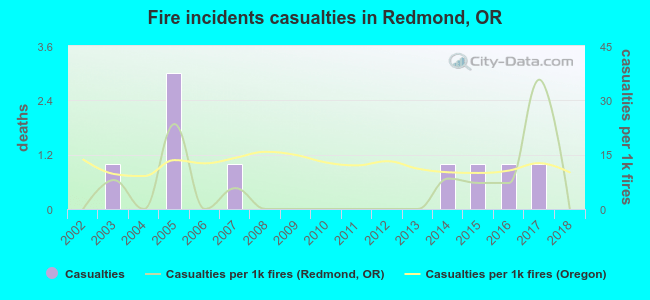 Based on the reports from the years 2002 - 2018 the average number of fire-related yearly casualties is 1. The highest number of injuries - 3 took place in 2005, and the lowest - 0 in 2002. The data has a constant trend.
The average number of casualties per 1,000 fires is 6. This indicator was the highest - 36 in 2017, and the lowest 0 in 2002. The trend for casualties per 1,000 fires is constant. Compared to the state value the number of injuries per 1,000 incidents is much lower.
Based on the reports from the years 2002 - 2018 the average number of fire-related yearly casualties is 1. The highest number of injuries - 3 took place in 2005, and the lowest - 0 in 2002. The data has a constant trend.
The average number of casualties per 1,000 fires is 6. This indicator was the highest - 36 in 2017, and the lowest 0 in 2002. The trend for casualties per 1,000 fires is constant. Compared to the state value the number of injuries per 1,000 incidents is much lower.Casualties per 1,000 incidents in Redmond, OR compared to nearest cities:
(Note: Based on data for all years, including only cities with at least 500 fire incidents)
| Redmond: | 4.6 |
| Bend: | 12.6 |
| Prineville: | 9.2 |
| Sisters: | 1.2 |
| Madras: | 4.3 |
| La Pine: | 8.3 |
| Sweet Home: | 20.6 |
| Lebanon: | 24.2 |
| Stayton: | 23.3 |
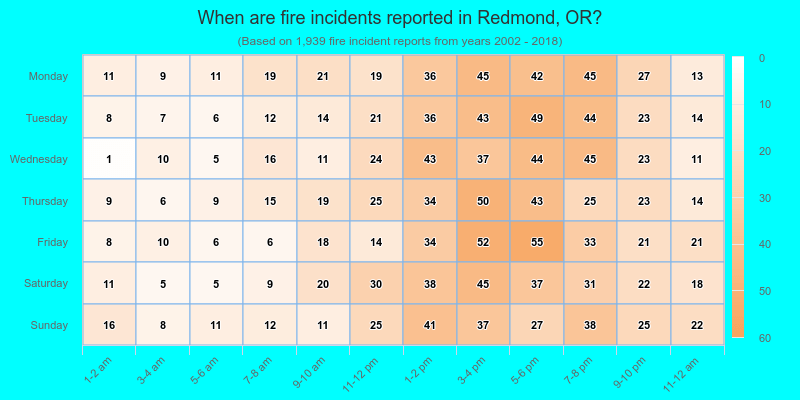
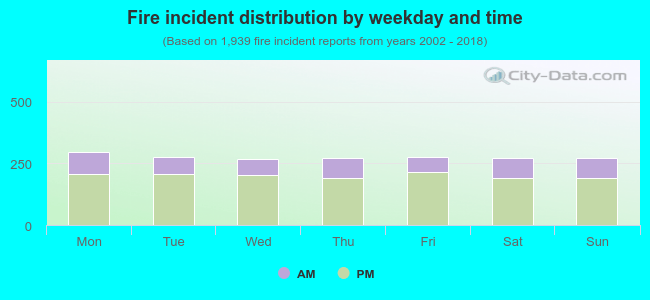 27.5% incidents where reported in the morning and 72.5% in the evening. The most fires (15.4%) took place on Monday, and the least (13.9%) on Wednesday.
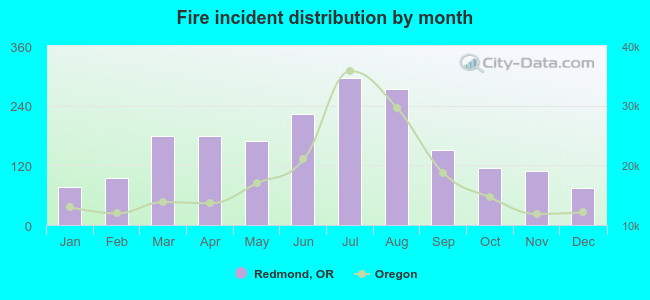 According to the 1,939 fire incident reports from years 2002 - 2018 most fires (15.3%) took place during July, and the least (3.8%) in December.
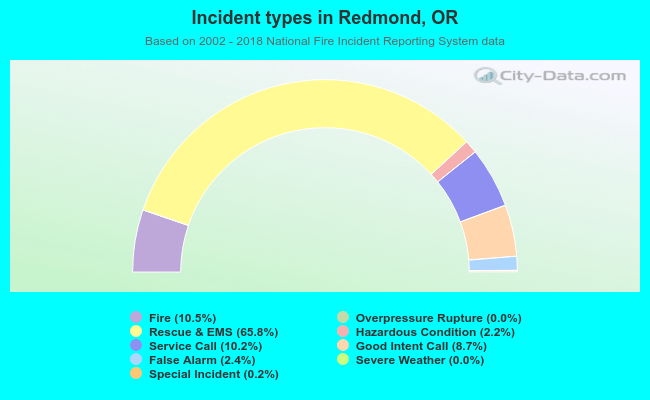 Out of all 18,501 cases reported during the years 2002 - 2018, the most belonged to the categories: Rescue & EMS (65.8%), Fire (10.5%), and Service Call (10.2%).
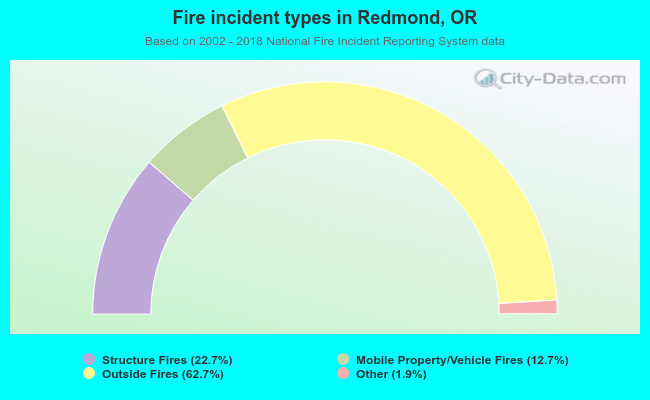 When looking into fire subcategories, the most incidents belonged to: Outside Fires (62.7%), and Structure Fires (22.7%).