Redding: Fire Incidents, California (CA)
Where are fire incidents reported in Redding, CA
Something went wrong! Please refresh the page.
| Fire incidents reported | |
|---|---|
| Sreet name | Count |
| HILLTOP DR | 290 |
| CHURN CREEK RD | 286 |
| DANA DR | 194 |
| HARTNELL AVE | 186 |
| LAKE BLVD | 186 |
| CYPRESS AVE | 184 |
| MARKET ST | 180 |
| WESTSIDE RD | 126 |
| EUREKA WAY | 122 |
| VICTOR AVE | 114 |
| BECHELLI LN | 98 |
| EASTSIDE RD | 88 |
| PINE ST | 74 |
| OLD OREGON TRL | 70 |
| PLACER ST | 70 |
| QUARTZ HILL RD | 64 |
| YUBA ST | 62 |
| TWIN VIEW BLVD | 58 |
| AIRPORT RD | 56 |
| RAILROAD AVE | 56 |
| WEST ST | 56 |
| PARKVIEW AVE | 54 |
| COURT ST | 50 |
| OASIS RD | 50 |
| OLD ALTURAS RD | 48 |
| STATE HWY 273 | 48 |
| CALIFORNIA ST | 44 |
| CEDARS RD | 42 |
| INTERSTATE 5 NB | 42 |
| LOCUST ST | 40 |
| Other | 1,816 |
2005 - 2018 National Fire Incident Reporting System (NFIRS) incidents
- Incident types reported to NFIRS in Redding, CA
- 25,67055.4%Rescue & EMS
- 7,13415.4%Good Intent Call
- 4,88610.5%Service Call
- 4,85410.5%Fire
- 2,2744.9%Hazardous Condition
- 1,3392.9%False Alarm
- 980.2%Overpressure Rupture
- 630.1%Special Incident
- Fire incident types reported to NFIRS in Redding, CA
- 2,41049.6%Outside Fires
- 1,42429.3%Structure Fires
- 75315.5%Mobile Property/Vehicle Fires
- 2675.5%Other
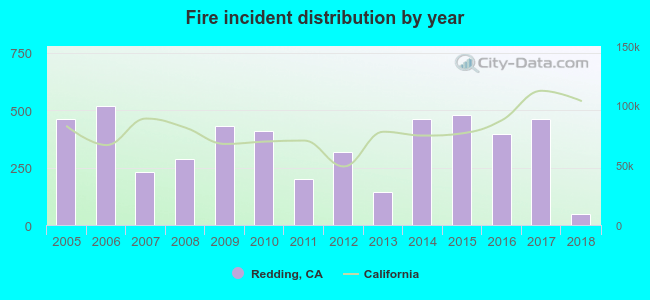 Based on the data from the years 2005 - 2018 the average number of fire incidents per year is 347. The highest number of reported fires - 520 took place in 2006, and the least - 49 in 2018. The data has a dropping trend.
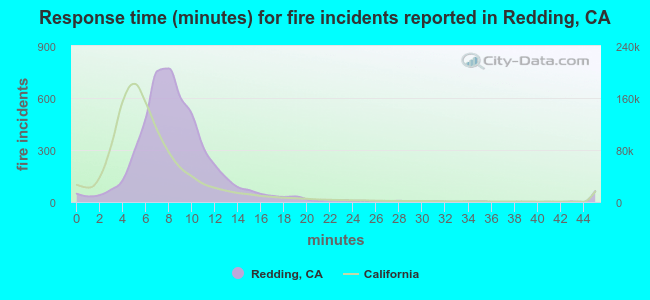 The median response time based on all reported fire incidents is 8 minutes. This is higher than the state median value.
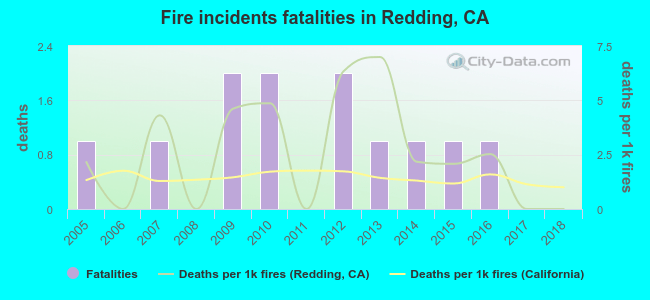 According to the data from the years 2005 - 2018 the average number of fire-related fatalities per year is 1. The highest number of deaths - 2 took place in 2009, and the lowest - 0 in 2006. The data has a decreasing trend.
The average number of fatalities per 1,000 fire incidents is 3. This indicator was the highest - 7 in 2013, and the lowest 0 in 2006. The trend for deaths per 1,000 fire incidents is decreasing. Compared to the state value the number of deaths per 1,000 incidents is higher.
According to the data from the years 2005 - 2018 the average number of fire-related fatalities per year is 1. The highest number of deaths - 2 took place in 2009, and the lowest - 0 in 2006. The data has a decreasing trend.
The average number of fatalities per 1,000 fire incidents is 3. This indicator was the highest - 7 in 2013, and the lowest 0 in 2006. The trend for deaths per 1,000 fire incidents is decreasing. Compared to the state value the number of deaths per 1,000 incidents is higher.Deaths per 1,000 incidents in Redding, CA compared to nearest cities:
(Note: Based on data for all years, including only cities with at least 2,500 fire incidents)
| Redding: | 2.5 |
| Chico: | 1.1 |
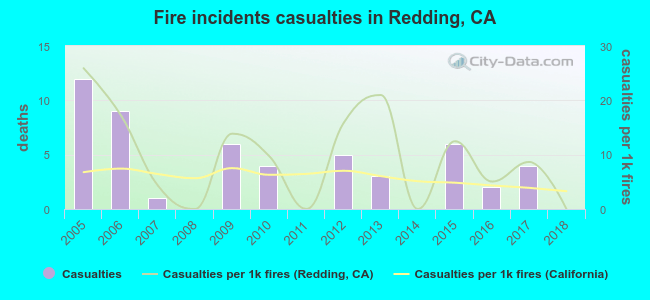 Based on the data from the years 2005 - 2018 the average number of fire-related casualties per year is 4. The highest number of casualties - 12 took place in 2005, and the lowest - 0 in 2008. The data has a declining trend.
The average number of casualties per 1,000 fire incidents is 10. This indicator was the highest - 26 in 2005, and the lowest 0 in 2008. The trend for injuries per 1,000 fire incidents is dropping. Compared to the state value the number of injuries per 1,000 fire incidents is higher.
Based on the data from the years 2005 - 2018 the average number of fire-related casualties per year is 4. The highest number of casualties - 12 took place in 2005, and the lowest - 0 in 2008. The data has a declining trend.
The average number of casualties per 1,000 fire incidents is 10. This indicator was the highest - 26 in 2005, and the lowest 0 in 2008. The trend for injuries per 1,000 fire incidents is dropping. Compared to the state value the number of injuries per 1,000 fire incidents is higher.
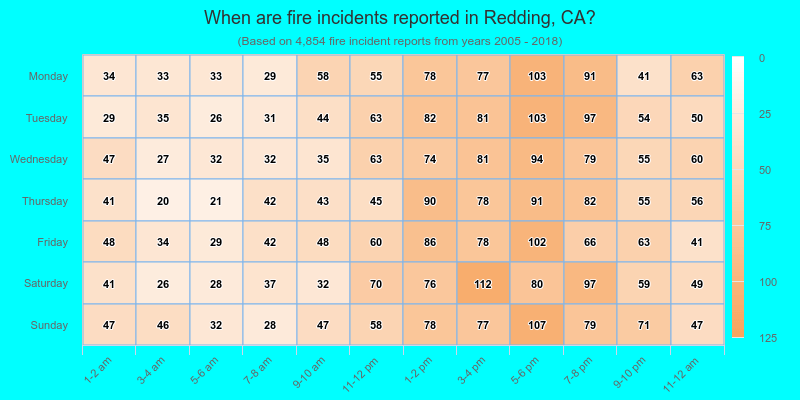
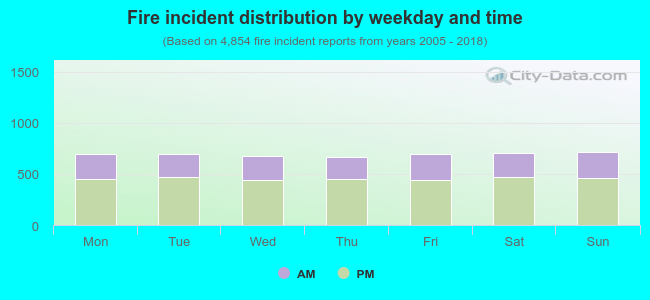 34.4% incidents where reported in the morning and 65.6% in the evening. The most fires (14.8%) took place on Sunday, and the least (13.7%) on Thursday.
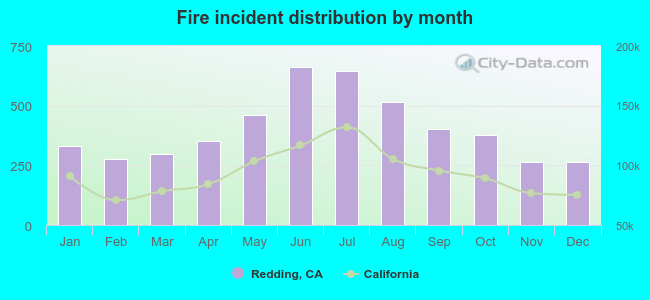 Based on the 4,854 incident reports from years 2005 - 2018 most fires (13.7%) took place during June, and the least (5.5%) in December.
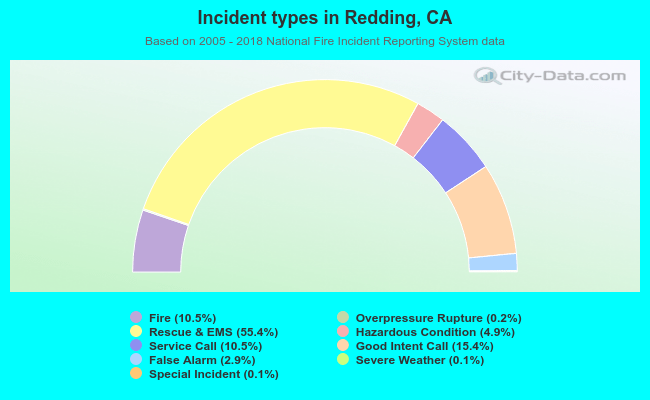 Out of all 46,342 cases reported during the years 2005 - 2018, the most belonged to the categories: Rescue & EMS (55.4%), Good Intent Call (15.4%), and Service Call (10.5%).
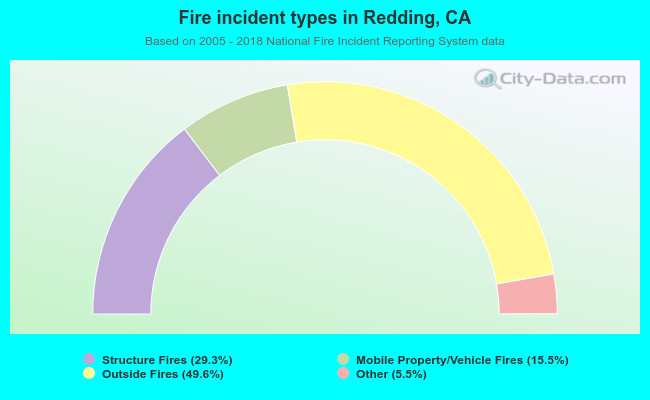 When looking into fire subcategories, the most reports belonged to: Outside Fires (49.6%), and Structure Fires (29.3%).