Racine: Fire Incidents, Wisconsin (WI)
Where are fire incidents reported in Racine, WI
Something went wrong! Please refresh the page.
| Fire incidents reported | |
|---|---|
| Sreet name | Count |
| MAIN ST | 234 |
| WASHINGTON AVE | 214 |
| ERIE ST | 162 |
| MEMORIAL DR | 154 |
| DURAND AVE | 126 |
| SPRING ST | 110 |
| JACATO DR | 104 |
| DOUGLAS AV | 90 |
| GREEN BAY RD | 88 |
| OAKES RD | 78 |
| DOUGLAS AVE | 76 |
| HOWE ST | 70 |
| WASHINGTON AV | 64 |
| WASHINGTON | 62 |
| OHIO ST | 60 |
| RACINE ST | 60 |
| DURAND AV | 58 |
| BRAUN RD | 52 |
| SIXTH ST | 52 |
| 16TH ST | 50 |
| CENTER ST | 50 |
| SHERIDAN RD | 48 |
| MEAD ST | 46 |
| SEVENTH ST | 46 |
| TAYLOR AVE | 46 |
| TWELFTH ST | 46 |
| CARLISLE AV | 44 |
| TAYLOR AV | 44 |
| WISCONSIN AV | 44 |
| 21 ST | 42 |
| Other | 1,907 |
2002 - 2018 National Fire Incident Reporting System (NFIRS) incidents
- Incident types reported to NFIRS in Racine, WI
- 5,27228.7%Rescue & EMS
- 4,32723.5%Fire
- 3,77220.5%Hazardous Condition
- 2,52713.7%False Alarm
- 1,3887.6%Good Intent Call
- 1,0025.5%Service Call
- 390.2%Overpressure Rupture
- 360.2%Special Incident
- 200.1%Severe Weather
- Fire incident types reported to NFIRS in Racine, WI
- 2,33153.9%Structure Fires
- 1,09025.2%Outside Fires
- 70016.2%Mobile Property/Vehicle Fires
- 2064.8%Other
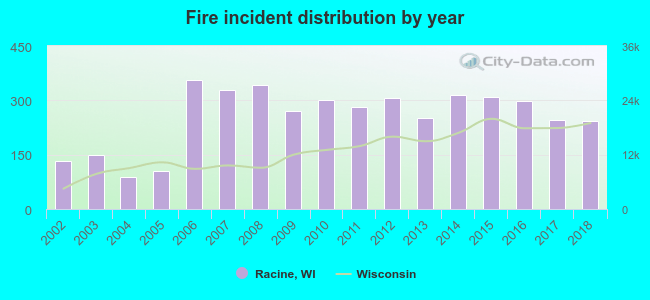 According to the data from the years 2002 - 2018 the average number of fire incidents per year is 255. The highest number of reported fire incidents - 356 took place in 2006, and the least - 87 in 2004. The data has an increasing trend.
The average number of yearly fire incidents per 10k residents in Racine, WI compared to nearest cities:
(Note: Based on data for the last 3 years, including only cities with population 5,000 and above)
| Racine: | 33.7 |
| Mount Pleasant: | 8.9 |
| Caledonia: | 8.1 |
| Sturtevant: | 43.0 |
| Somers: | 39.9 |
| Kenosha: | 23.0 |
| Oak Creek: | 30.0 |
| South Milwaukee: | 23.5 |
| Pleasant Prairie: | 20.6 |
 The median response time based on all reported fire incidents is 5 minutes. This is lower than the state median value.
The median response time in Racine, WI compared to nearest cities:
(Note: Based on data for all years, including only cities with at least 500 fire incidents)
| Racine: | 5 minutes |
| Kenosha: | 4 minutes |
| Oak Creek: | 6 minutes |
| Union Grove: | 11 minutes |
| South Milwaukee: | 3 minutes |
| Pleasant Prairie: | 5 minutes |
| Franklin: | 6 minutes |
| Cudahy: | 3 minutes |
| Winthrop Harbor: | 5 minutes |
 According to the reports from the years 2002 - 2018 the average number of fire-related yearly deaths is 1. The highest number of reported deaths - 4 took place in 2014, and the lowest - 0 in 2002. The data has a growing trend.
The average number of deaths per 1,000 fire incidents is 3. This indicator was the highest - 13 in 2014, and the lowest 0 in 2002. The trend for deaths per 1,000 incidents is growing. Compared to the Wisconsin value the number of deaths per 1,000 incidents is higher.
According to the reports from the years 2002 - 2018 the average number of fire-related yearly deaths is 1. The highest number of reported deaths - 4 took place in 2014, and the lowest - 0 in 2002. The data has a growing trend.
The average number of deaths per 1,000 fire incidents is 3. This indicator was the highest - 13 in 2014, and the lowest 0 in 2002. The trend for deaths per 1,000 incidents is growing. Compared to the Wisconsin value the number of deaths per 1,000 incidents is higher.
 According to the reports from the years 2002 - 2018 the average number of fire-related casualties per year is 3. The highest number of reported injuries - 9 took place in 2014, and the lowest - 1 in 2004. The data has a declining trend.
The average number of casualties per 1,000 fire incidents is 15. This indicator was the highest - 66 in 2005, and the lowest 3 in 2007. The trend for casualties per 1,000 incidents is declining. Compared to the state value the number of injuries per 1,000 incidents is higher.
According to the reports from the years 2002 - 2018 the average number of fire-related casualties per year is 3. The highest number of reported injuries - 9 took place in 2014, and the lowest - 1 in 2004. The data has a declining trend.
The average number of casualties per 1,000 fire incidents is 15. This indicator was the highest - 66 in 2005, and the lowest 3 in 2007. The trend for casualties per 1,000 incidents is declining. Compared to the state value the number of injuries per 1,000 incidents is higher.Casualties per 1,000 incidents in Racine, WI compared to nearest cities:
(Note: Based on data for all years, including only cities with at least 500 fire incidents)
| Racine: | 13.2 |
| Kenosha: | 26.3 |
| Oak Creek: | 15.1 |
| Union Grove: | 5.1 |
| South Milwaukee: | 18.4 |
| Pleasant Prairie: | 48.8 |
| Franklin: | 11.6 |
| Cudahy: | 8.5 |
| Winthrop Harbor: | 15.2 |
 33.7% incidents where reported in the morning and 66.3% in the evening. The most fires (15.3%) took place on Sunday, and the least (12.9%) on Friday.
 Based on the 4,327 fires from years 2002 - 2018 most fires (9.9%) took place during July, and the least (6.7%) in January.
 Out of all 18,383 cases reported during the years 2002 - 2018, the most belonged to the categories: Rescue & EMS (28.7%), Fire (23.5%), and Hazardous Condition (20.5%).
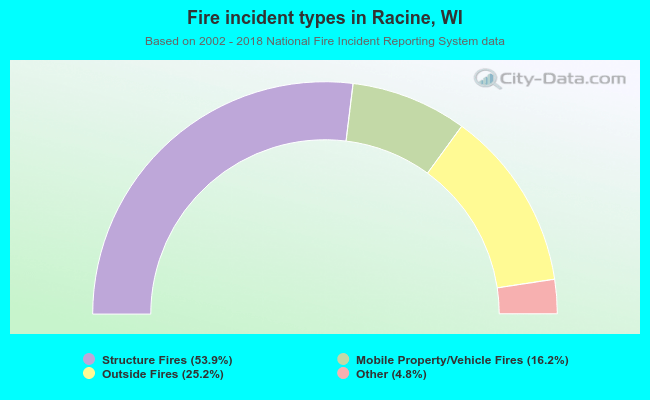 When looking into fire subcategories, the most reports belonged to: Structure Fires (53.9%), and Outside Fires (25.2%).