Plano: Fire Incidents, Illinois (IL)
Where are fire incidents reported in Plano, IL
Something went wrong! Please refresh the page.
|
| |||||||||||||||||||||||||||||||||||||||||||||||||||||||||||||||||||||||||||||||||||||||||||||||||||||||||||||
2002 - 2018 National Fire Incident Reporting System (NFIRS) incidents
- Incident types reported to NFIRS in Plano, IL
- 3,52059.8%Rescue & EMS
- 61410.4%Fire
- 60010.2%Hazardous Condition
- 4928.4%Service Call
- 3305.6%False Alarm
- 3285.6%Good Intent Call
- Fire incident types reported to NFIRS in Plano, IL
- 25241.0%Outside Fires
- 24039.1%Structure Fires
- 8413.7%Mobile Property/Vehicle Fires
- 386.2%Other
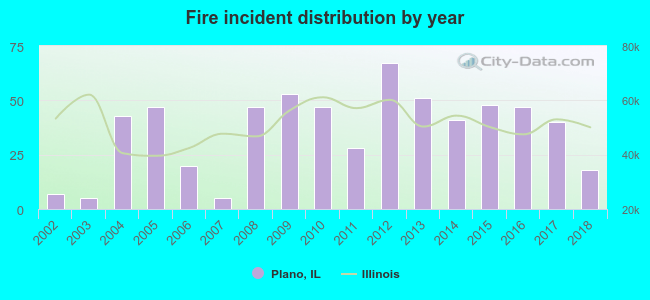 Based on the data from the years 2002 - 2018 the average number of fires per year is 36. The highest number of fire incidents - 67 took place in 2012, and the least - 5 in 2003. The data has a rising trend.
The average number of yearly fire incidents per 10k residents in Plano, IL compared to nearest cities:
(Note: Based on data for the last 3 years, including only cities with population 5,000 and above)
| Plano: | 31.3 |
| Sandwich: | 57.6 |
| Yorkville: | 42.2 |
| Sugar Grove: | 41.0 |
| Oswego: | 18.8 |
| Montgomery: | 37.0 |
| Aurora: | 11.7 |
| North Aurora: | 16.9 |
| Elburn: | 84.5 |
 The median response time based on all reported fire incidents is 6 minutes. This is comparable to the Illinois median value.
The median response time in Plano, IL compared to nearest cities:
(Note: Based on data for all years, including only cities with at least 500 fire incidents)
| Plano: | 6 minutes |
| Sandwich: | 8 minutes |
| Yorkville: | 6 minutes |
| Sugar Grove: | 7 minutes |
| Oswego: | 6 minutes |
| Montgomery: | 6 minutes |
| Aurora: | 5 minutes |
| North Aurora: | 5 minutes |
| Elburn: | 8 minutes |
 27.4% incidents where reported in the morning and 72.6% in the evening. The most fires (18.4%) took place on Sunday, and the least (11.2%) on Tuesday.
 According to the 614 incident reports from years 2002 - 2018 most fires (11.7%) took place during July, and the least (6.0%) in February.
 Out of all 5,888 cases reported during the years 2002 - 2018, the most belonged to the categories: Rescue & EMS (59.8%), Fire (10.4%), and Hazardous Condition (10.2%).
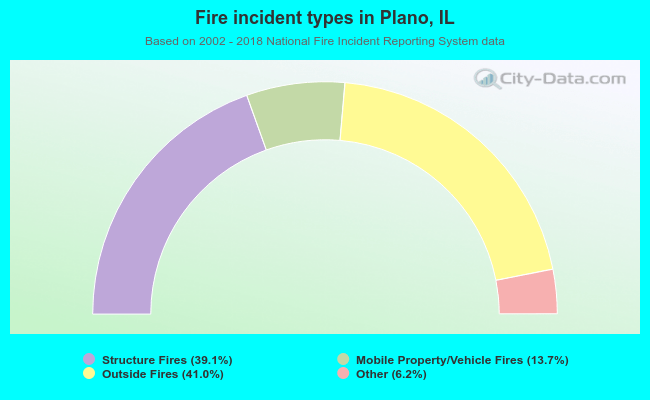 When looking into fire subcategories, the most incidents belonged to: Outside Fires (41.0%), and Structure Fires (39.1%).