Pemberville: Fire Incidents, Ohio (OH)
Where are fire incidents reported in Pemberville, OH
Something went wrong! Please refresh the page.
|
| |||||||||||||||||||||||||||||||||||||||||||||||||||||||||||||||||||||||||||||||||||||||||||||||||||||||||||||
2002 - 2018 National Fire Incident Reporting System (NFIRS) incidents
- Incident types reported to NFIRS in Pemberville, OH
- 33242.2%Fire
- 14618.6%Rescue & EMS
- 13316.9%Hazardous Condition
- 8010.2%Good Intent Call
- 729.2%False Alarm
- 151.9%Service Call
- 50.6%Overpressure Rupture
- 20.3%Severe Weather
- 10.1%Special Incident
- Fire incident types reported to NFIRS in Pemberville, OH
- 13941.9%Outside Fires
- 13841.6%Structure Fires
- 5215.7%Mobile Property/Vehicle Fires
- 30.9%Other
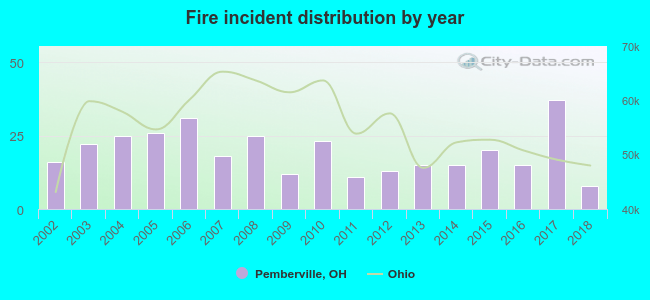 Based on the data from the years 2002 - 2018 the average number of fires per year is 20. The highest number of reported fires - 37 took place in 2017, and the least - 8 in 2018. The data has a declining trend.
 Based on the reports from the years 2002 - 2018 the average number of fire-related casualties per year is 0. The highest number of injuries - 2 took place in 2010, and the lowest - 0 in 2002. The data has a constant trend.
 28.3% incidents where reported in the morning and 71.7% in the evening. The most fires (16.6%) took place on Thursday, and the least (12.3%) on Tuesday.
 According to the 332 reports from years 2002 - 2018 most fires (16.3%) took place during March, and the least (4.5%) in May.
 Out of all 786 cases reported during the years 2002 - 2018, the most belonged to the categories: Fire (42.2%), Rescue & EMS (18.6%), and Hazardous Condition (16.9%).
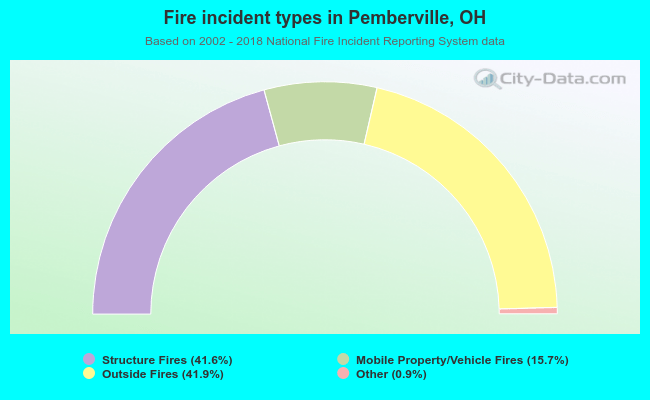 When looking into fire subcategories, the most incidents belonged to: Outside Fires (41.9%), and Structure Fires (41.6%).