Pauline: Fire Incidents, South Carolina (SC)
Where are fire incidents reported in Pauline, SC
Something went wrong! Please refresh the page.
|
| |||||||||||||||||||||||||||||||||||||||||||||||||||||||||||||||||||||||||||||||||||||||||||||||||||||||||||||
2002 - 2018 National Fire Incident Reporting System (NFIRS) incidents
- Incident types reported to NFIRS in Pauline, SC
- 33241.1%Fire
- 16920.9%Rescue & EMS
- 8510.5%Good Intent Call
- 8210.1%Hazardous Condition
- 739.0%False Alarm
- 293.6%Service Call
- 212.6%Special Incident
- 162.0%Severe Weather
- 10.1%Overpressure Rupture
- Fire incident types reported to NFIRS in Pauline, SC
- 16850.6%Outside Fires
- 12838.6%Structure Fires
- 329.6%Mobile Property/Vehicle Fires
- 41.2%Other
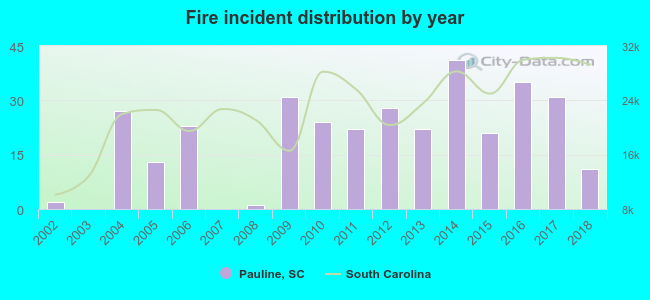 According to the data from the years 2002 - 2018 the average number of fire incidents per year is 20. The highest number of fire incidents - 41 took place in 2014, and the least - 0 in 2003. The data has a growing trend.
The average number of yearly fire incidents per 10k residents in Pauline, SC compared to nearest cities:
(Note: Based on data for the last 3 years, including only cities with population 5,000 and above)
| Pauline: | 25.2 |
| Spartanburg: | 214.9 |
| Valley Falls: | 1.6 |
| Union: | 106.5 |
| Boiling Springs: | 124.5 |
| Fountain Inn: | 150.0 |
| Greer: | 107.6 |
| Macedonia: | 2.0 |
| Simpsonville: | 61.9 |

 26.2% incidents where reported in the morning and 73.8% in the evening. The most fires (18.1%) took place on Saturday, and the least (12.0%) on Tuesday.
 According to the 332 fire incidents from years 2002 - 2018 most fires (14.5%) took place during February, and the least (4.8%) in September.
 Out of all 808 cases reported during the years 2002 - 2018, the most belonged to the categories: Fire (41.1%), Rescue & EMS (20.9%), and Good Intent Call (10.5%).
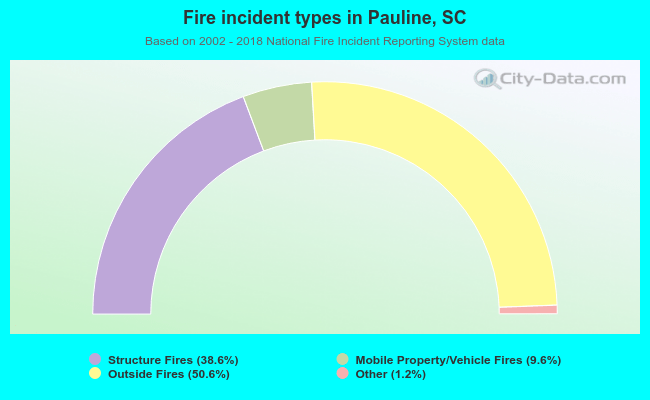 When looking into fire subcategories, the most reports belonged to: Outside Fires (50.6%), and Structure Fires (38.6%).