Pascagoula: Fire Incidents, Mississippi (MS)
Where are fire incidents reported in Pascagoula, MS
Something went wrong! Please refresh the page.
| Fire incidents reported | |
|---|---|
| Sreet name | Count |
| DENNY AVE | 366 |
| OLD MOBILE HWY | 224 |
| CHICOT ST | 204 |
| EDEN ST | 182 |
| MARKET ST | 178 |
| NATHAN HALE AVE | 146 |
| ORCHARD AVE | 138 |
| INGALLS AVE | 134 |
| TELEPHONE RD | 106 |
| SCOVAL AVE | 100 |
| PASCAGOULA ST | 78 |
| SHORT CUT RD | 78 |
| 14TH ST | 74 |
| JEFFERSON AVE | 74 |
| JACKSON AVE | 72 |
| MELTON AVE | 64 |
| HOSPITAL ST | 62 |
| 13TH ST | 60 |
| CONVENT AVE | 58 |
| INDUSTRIAL RD | 58 |
| 22ND ST | 56 |
| BELAIR ST | 56 |
| MARTIN ST | 56 |
| ROBINHOOD ST | 56 |
| BRAZIL ST | 54 |
| LANIER AVE | 52 |
| LONG AVE | 52 |
| MONACO DR | 52 |
| POLK AVE | 46 |
| BEACH BLVD | 44 |
| Other | 76 |
2002 - 2018 National Fire Incident Reporting System (NFIRS) incidents
- Incident types reported to NFIRS in Pascagoula, MS
- 7,57549.0%Rescue & EMS
- 3,05619.8%Fire
- 1,97512.8%Good Intent Call
- 1,4079.1%Hazardous Condition
- 7284.7%False Alarm
- 6444.2%Service Call
- 290.2%Special Incident
- 200.1%Overpressure Rupture
- Fire incident types reported to NFIRS in Pascagoula, MS
- 1,48648.6%Structure Fires
- 1,00032.7%Outside Fires
- 49716.3%Mobile Property/Vehicle Fires
- 732.4%Other
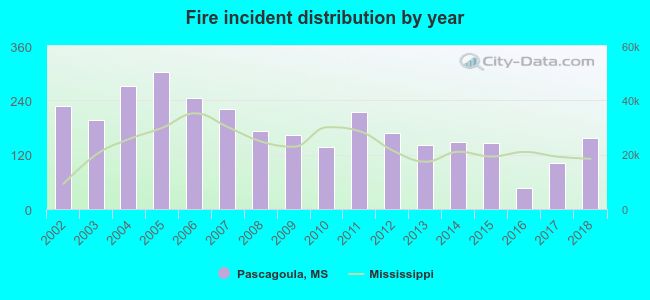 According to the data from the years 2002 - 2018 the average number of fires per year is 180. The highest number of fires - 302 took place in 2005, and the least - 46 in 2016. The data has a declining trend.
The average number of yearly fire incidents per 10k residents in Pascagoula, MS compared to nearest cities:
(Note: Based on data for the last 3 years, including only cities with population 5,000 and above)
| Pascagoula: | 45.6 |
| Moss Point: | 160.4 |
| Gautier: | 53.1 |
| Vancleave: | 115.5 |
| Ocean Springs: | 102.1 |
| Biloxi: | 53.3 |
| Gulfport: | 58.2 |
| Long Beach: | 30.0 |
| Pass Christian: | 159.5 |
 The median response time based on all reported fire incidents is 3 minutes. This is much lower than the state median value.
The median response time in Pascagoula, MS compared to nearest cities:
(Note: Based on data for all years, including only cities with at least 500 fire incidents)
| Pascagoula: | 3 minutes |
| Moss Point: | 5 minutes |
| Gautier: | 4 minutes |
| Vancleave: | 9 minutes |
| Ocean Springs: | 4 minutes |
| Hurley: | 7 minutes |
| Biloxi: | 4 minutes |
| Theodore: | 7 minutes |
| Gulfport: | 5 minutes |
 According to the reports from the years 2002 - 2018 the average number of fire-related yearly deaths is 0. The highest number of reported deaths - 2 took place in 2011, and the lowest - 0 in 2002. The data has a rising trend.
The average number of deaths per 1,000 fire incidents is 3. This indicator was the highest - 9 in 2011, and the lowest 0 in 2002. The trend for fatalities per 1,000 incidents is rising. Compared to the state value the number of deaths per 1,000 incidents is similar.
According to the reports from the years 2002 - 2018 the average number of fire-related yearly deaths is 0. The highest number of reported deaths - 2 took place in 2011, and the lowest - 0 in 2002. The data has a rising trend.
The average number of deaths per 1,000 fire incidents is 3. This indicator was the highest - 9 in 2011, and the lowest 0 in 2002. The trend for fatalities per 1,000 incidents is rising. Compared to the state value the number of deaths per 1,000 incidents is similar.Deaths per 1,000 incidents in Pascagoula, MS compared to nearest cities:
(Note: Based on data for all years, including only cities with at least 2,500 fire incidents)
| Pascagoula: | 2.6 |
| Moss Point: | 2.2 |
| Ocean Springs: | 1.1 |
| Biloxi: | 1.5 |
| Gulfport: | 2.3 |
| Mobile: | 0.9 |
| Lucedale: | 1.9 |
| Saucier: | 2.0 |
 29.4% incidents where reported in the morning and 70.6% in the evening. The most fires (15.4%) took place on Saturday, and the least (12.9%) on Wednesday.
 Based on the 3,056 fires from years 2002 - 2018 most fires (10.3%) took place during March, and the least (5.9%) in August.
 Out of all 15,444 cases reported during the years 2002 - 2018, the most belonged to the categories: Rescue & EMS (49.0%), Fire (19.8%), and Good Intent Call (12.8%).
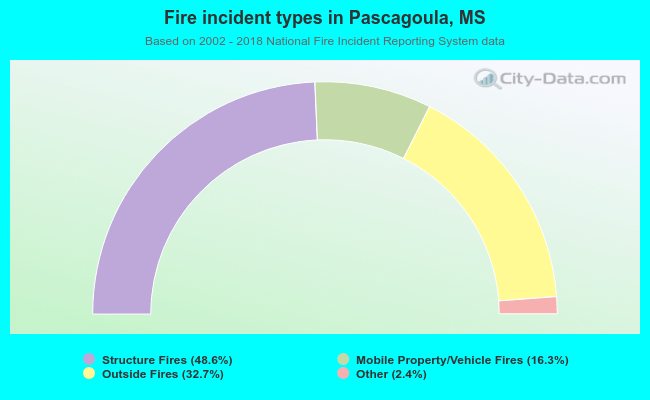 When looking into fire subcategories, the most incidents belonged to: Structure Fires (48.6%), and Outside Fires (32.7%).