| Fire incidents reported |
|---|
| Sreet name | Count |
|---|
| BRADFORD RD | 32 | | HIGHWAY 150 | 28 | | HWY 135 | 22 | | WENNINGS RD | 22 | | HIGHWAY 135 | 20 | | BRADFORD WOODS | 18 | | HANCOCK CHAPEL RD | 16 | | AJ AVE | 14 | | FLATWOODS RD | 14 | | KENNEDY / MOTT RD | 14 | | NEW CUT RD | 14 | | CRAWFORD RD | 12 | | HWY 150 HWY | 12 | | MAIN ST | 12 | | BUFFALO TRACE RD | 10 | | CORYDON / RAMSEY RD | 10 | | OLD EAST RD | 10 | | TURKEY FARM RD | 10 | | BIG SPRINGS RD | 8 | | BUFFALO TRACE | 8 | | MARTIN MATHAS RD | 8 | | PALMYRA LAKE RD | 8 | | BRADFORD WOODS DR | 6 | | BRUNNER HILL RD | 6 | | COPLIN DR | 6 |
| | | Fire incidents reported |
|---|
| Sreet name | Count |
|---|
| COUNTY LINE RD | 6 | | GETTLEFINGER RD | 6 | | HWY 150 | 6 | | KINGS DR | 6 | | LOSSON RD | 6 | | MARTINSBURG FIRE RD | 6 | | MARVEY LANE | 6 | | RULLELL LOOP | 6 | | SCHOOL LANE | 6 | | SENN CT | 6 | | TREE DR | 6 | | UHL LANE | 6 | | BRADFORD RD | 4 | | CANDY APPLE LN | 4 | | CHEVY DR | 4 | | CHURCH RD | 4 | | CREEKSIDE DR | 4 | | CROSS RD | 4 | | DOGWOOD ESTATES | 4 | | GREENE ST | 4 | | HANDCOCK CHAPPEL RD | 4 | | HUNTER RD | 4 | | KINGS LANE | 4 | | LOSSON RD | 4 | | |
|
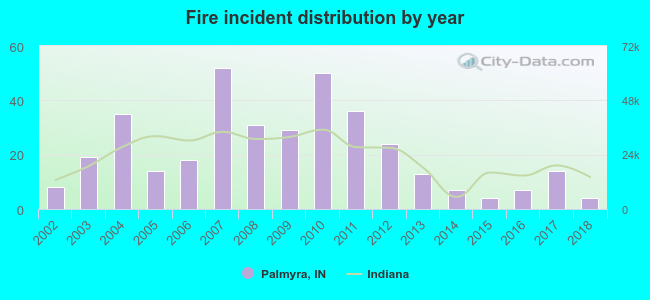 Based on the data from the years 2002 - 2018 the average number of fires per year is 21. The highest number of reported fire incidents - 52 took place in 2007, and the least - 4 in 2015. The data has a declining trend.
 26.3% incidents where reported in the morning and 73.7% in the evening. The most fires (15.9%) took place on Thursday, and the least (12.6%) on Tuesday.
 Based on the 365 incident reports from years 2002 - 2018 most fires (13.2%) took place during March, and the least (5.5%) in May.
 Out of all 921 cases reported during the years 2002 - 2018, the most belonged to the categories: Fire (39.6%), Rescue & EMS (29.8%), and Good Intent Call (13.9%).
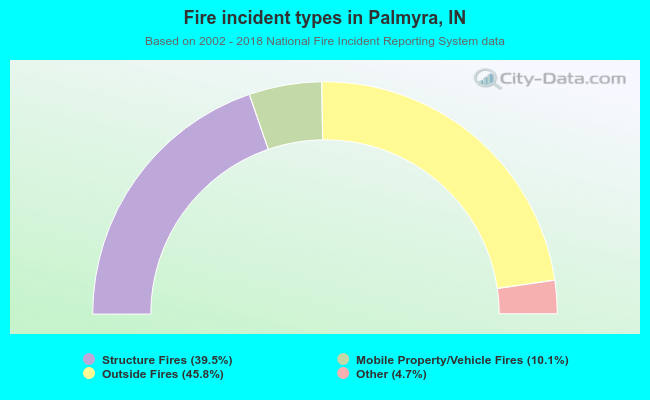 When looking into fire subcategories, the most incidents belonged to: Outside Fires (45.8%), and Structure Fires (39.5%).