Oxnard: Fire Incidents, California (CA)
Where are fire incidents reported in Oxnard, CA
Something went wrong! Please refresh the page.
| Fire incidents reported | |
|---|---|
| Sreet name | Count |
| SAVIERS RD | 130 |
| VENTURA RD | 130 |
| OXNARD BLVD | 128 |
| ROSE AVE | 128 |
| VINEYARD AVE | 92 |
| F ST | 88 |
| 5TH ST | 84 |
| CUESTA DEL MAR DR | 78 |
| GONZALES RD | 76 |
| PERKINS RD | 76 |
| PLEASANT VALLEY RD | 74 |
| CHANNEL ISLANDS BLVD | 68 |
| J ST | 60 |
| C ST | 58 |
| OXNARD BL | 56 |
| HILL ST | 52 |
| CAMINO DEL SOL | 50 |
| ESPLANADE DR | 50 |
| E ST | 48 |
| LOCKWOOD ST | 48 |
| VENTURA BLVD | 48 |
| G ST | 44 |
| HARBOR BLVD | 44 |
| HUENEME RD | 42 |
| OCEAN DR | 40 |
| PERKINS | 40 |
| A ST | 38 |
| PENINSULA RD | 38 |
| VICTORIA AVE | 38 |
| VENTURA | 36 |
| Other | 891 |
2005 - 2018 National Fire Incident Reporting System (NFIRS) incidents
- Incident types reported to NFIRS in Oxnard, CA
- 36,15869.4%Rescue & EMS
- 5,85711.2%Good Intent Call
- 2,8735.5%Fire
- 2,7935.4%Service Call
- 2,2734.4%False Alarm
- 2,0423.9%Hazardous Condition
- Fire incident types reported to NFIRS in Oxnard, CA
- 1,23242.9%Outside Fires
- 1,09438.1%Structure Fires
- 36212.6%Mobile Property/Vehicle Fires
- 1856.4%Other
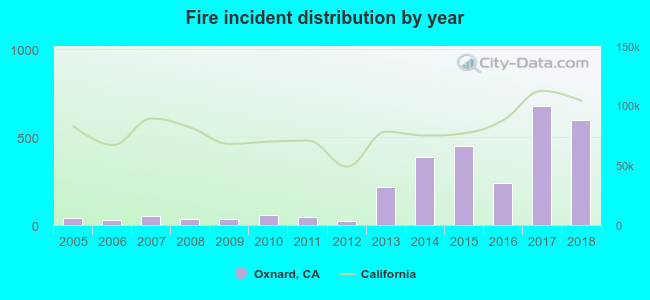 Based on the data from the years 2005 - 2018 the average number of fire incidents per year is 205. The highest number of reported fires - 679 took place in 2017, and the least - 22 in 2012. The data has an increasing trend.
The average number of yearly fire incidents per 10k residents in Oxnard, CA compared to nearest cities:
(Note: Based on data for the last 3 years, including only cities with population 5,000 and above)
| Oxnard: | 24.6 |
| Port Hueneme: | 26.3 |
| El Rio: | 43.5 |
| Ventura: | 37.4 |
| Camarillo: | 17.4 |
| Santa Paula: | 24.2 |
| Mira Monte: | 4.4 |
| Thousand Oaks: | 9.7 |
| Ojai: | 47.6 |
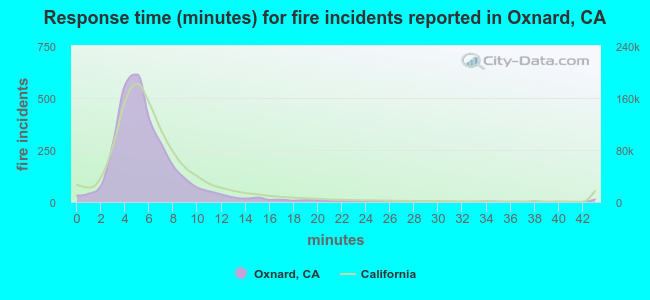 The median response time based on all reported fire incidents is 5 minutes. This is lower compared to the state median value.
The median response time in Oxnard, CA compared to nearest cities:
(Note: Based on data for all years, including only cities with at least 500 fire incidents)
| Oxnard: | 5 minutes |
| Port Hueneme: | 6 minutes |
| Ventura: | 7 minutes |
| Camarillo: | 6 minutes |
| Santa Paula: | 6 minutes |
| Thousand Oaks: | 6 minutes |
| Moorpark: | 7 minutes |
| Malibu: | 6 minutes |
| Simi Valley: | 6 minutes |
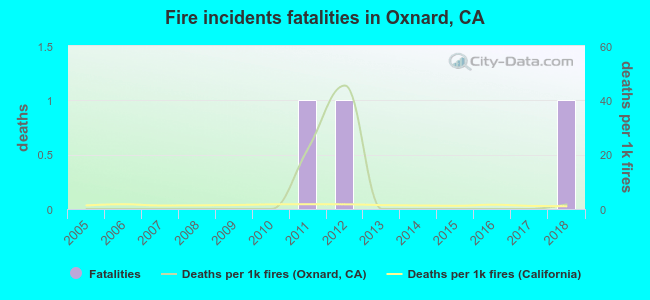 According to the data from the years 2005 - 2018 the average number of fire-related yearly deaths is 0. The highest number of deaths - 1 took place in 2011, and the lowest - 0 in 2005. The data has a growing trend.
The average number of fatalities per 1,000 fires is 5. This indicator was the highest - 45 in 2012, and the lowest 0 in 2005. The trend for deaths per 1,000 fires is growing. Compared to the state value the number of deaths per 1,000 incidents is lower.
According to the data from the years 2005 - 2018 the average number of fire-related yearly deaths is 0. The highest number of deaths - 1 took place in 2011, and the lowest - 0 in 2005. The data has a growing trend.
The average number of fatalities per 1,000 fires is 5. This indicator was the highest - 45 in 2012, and the lowest 0 in 2005. The trend for deaths per 1,000 fires is growing. Compared to the state value the number of deaths per 1,000 incidents is lower.Deaths per 1,000 incidents in Oxnard, CA compared to nearest cities:
(Note: Based on data for all years, including only cities with at least 2,500 fire incidents)
| Oxnard: | 1.0 |
| Santa Barbara: | 1.2 |
| Santa Clarita: | 0.0 |
| Los Angeles: | 2.0 |
| Burbank: | 1.2 |
| Inglewood: | 0.7 |
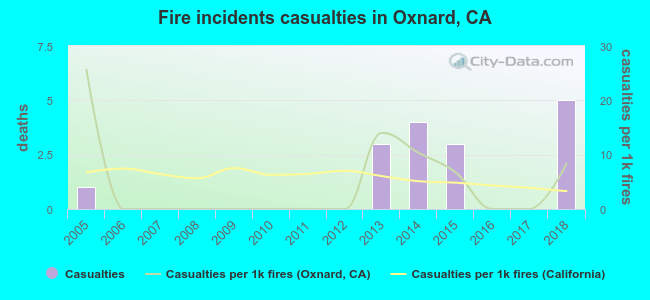 According to the data from the years 2005 - 2018 the average number of fire-related yearly casualties is 1. The highest number of casualties - 5 took place in 2018, and the lowest - 0 in 2006. The data has a rising trend.
The average number of injuries per 1,000 fire incidents is 5. This indicator was the highest - 26 in 2005, and the lowest 0 in 2006. The trend for casualties per 1,000 fire incidents is declining. Compared to the California value the number of injuries per 1,000 incidents is about the same.
According to the data from the years 2005 - 2018 the average number of fire-related yearly casualties is 1. The highest number of casualties - 5 took place in 2018, and the lowest - 0 in 2006. The data has a rising trend.
The average number of injuries per 1,000 fire incidents is 5. This indicator was the highest - 26 in 2005, and the lowest 0 in 2006. The trend for casualties per 1,000 fire incidents is declining. Compared to the California value the number of injuries per 1,000 incidents is about the same.Casualties per 1,000 incidents in Oxnard, CA compared to nearest cities:
(Note: Based on data for all years, including only cities with at least 500 fire incidents)
| Oxnard: | 5.6 |
| Port Hueneme: | 6.6 |
| Ventura: | 6.0 |
| Camarillo: | 4.1 |
| Santa Paula: | 6.3 |
| Thousand Oaks: | 9.8 |
| Moorpark: | 2.9 |
| Malibu: | 0.0 |
| Simi Valley: | 7.5 |
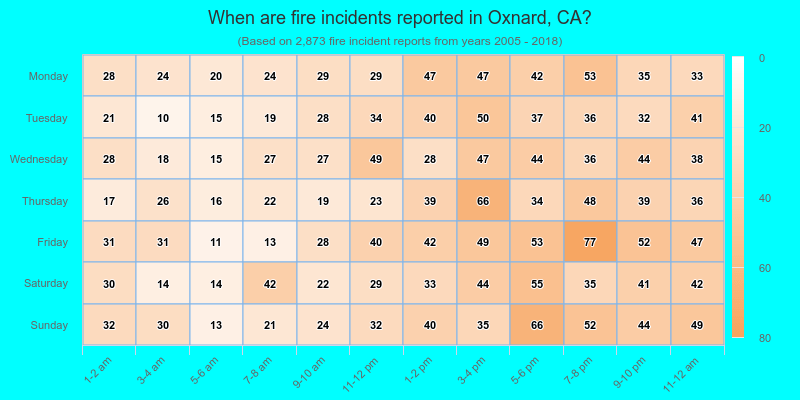
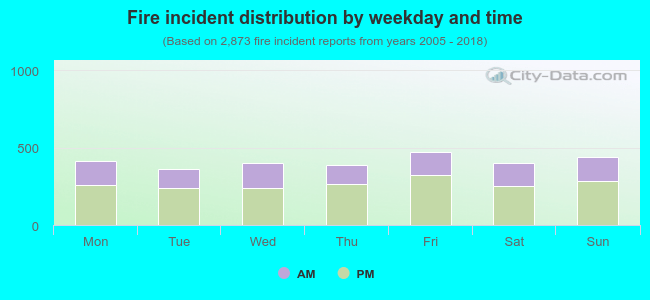 35.7% incidents where reported in the morning and 64.3% in the evening. The most fires (16.5%) took place on Friday, and the least (12.6%) on Tuesday.
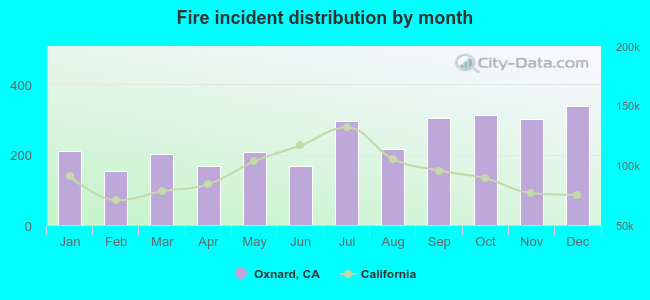 According to the 2,873 reports from years 2005 - 2018 most fires (11.8%) took place during December, and the least (5.3%) in February.
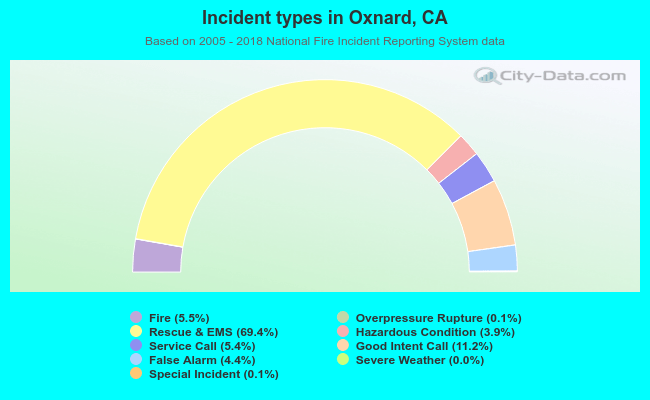 Out of all 52,082 cases reported during the years 2005 - 2018, the most belonged to the categories: Rescue & EMS (69.4%), Good Intent Call (11.2%), and Fire (5.5%).
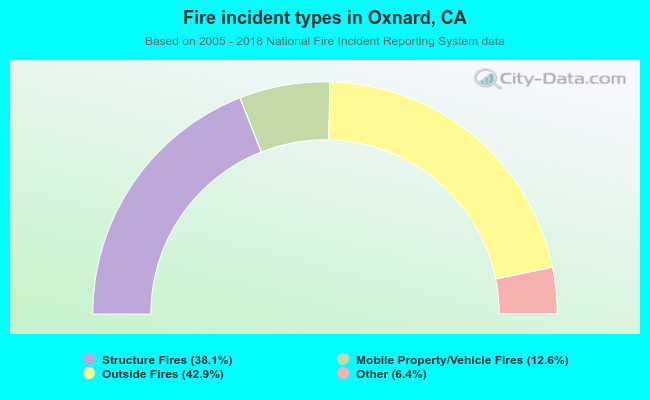 When looking into fire subcategories, the most reports belonged to: Outside Fires (42.9%), and Structure Fires (38.1%).