| Fire incidents reported |
|---|
| Sreet name | Count |
|---|
| OVILLA RD | 76 | | COCKRELL HILL RD | 58 | | WESTMORELAND RD | 46 | | HIGHLAND RD | 28 | | LARIAT TRL | 24 | | FM 664 RD | 18 | | SUBURBAN DR | 18 | | BUCKBOARD | 16 | | BUCKBOARD ST | 14 | | JOHNSON LN | 14 | | DUNCANVILLE RD | 12 | | MAIN ST | 12 | | WATER ST | 12 | | CUMBERLAND DR | 10 | | GLEN EAGLES DR | 10 | | SHILOH RD | 10 | | WINDING WAY CT | 10 | | BRYSON LN | 8 | | GEORGETOWN ST | 8 | | MEADOWLARK DR | 8 | | RED OAK CREEK RD | 8 | | WILLIAMSBURG LN | 8 | | WILLOW CREEK LN | 8 | | BURTONWOOD CIR | 6 | | CLAREMONT DR | 6 |
| | | Fire incidents reported |
|---|
| Sreet name | Count |
|---|
| COVINGTON LN | 6 | | EDGEWOOD LN | 6 | | GEORGETOWN RD | 6 | | HOLLY LN | 6 | | HOSFORD RD | 6 | | MEADOW GLEN LN | 6 | | SHADOWWOOD TRL | 6 | | SILVERWOOD DR | 6 | | WILLIAMSBURG | 6 | | ASHBURNE GLEN CIR | 4 | | BRYSON LANE | 4 | | CUMBERLAND | 4 | | EAST HIGHLAND | 4 | | ELM CREEK LN | 4 | | GREEN MEADOWS LN | 4 | | GREENWOOD | 4 | | GREENWOOD DR | 4 | | JOHNSON LANE | 4 | | MALLOY LN | 4 | | MEADOW LARK DR | 4 | | WHITE ROCK CT | 4 | | WILLOW CREEK | 4 | | WINDMILL RIDGE CIR | 4 | | ASHBURN GLEN CIROVL | 2 | | |
|
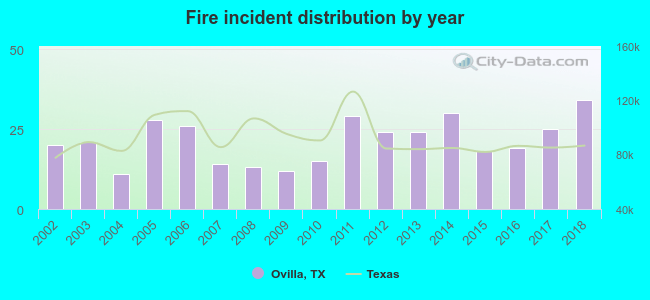 According to the data from the years 2002 - 2018 the average number of fires per year is 21. The highest number of reported fire incidents - 34 took place in 2018, and the least - 11 in 2004. The data has an increasing trend.
 26.7% incidents where reported in the morning and 73.3% in the evening. The most fires (16.3%) took place on Friday, and the least (11.6%) on Tuesday.
 According to the 363 reports from years 2002 - 2018 most fires (11.6%) took place during January, and the least (4.7%) in November.
 Out of all 3,961 cases reported during the years 2002 - 2018, the most belonged to the categories: Rescue & EMS (59.2%), Good Intent Call (13.4%), and Fire (9.2%).
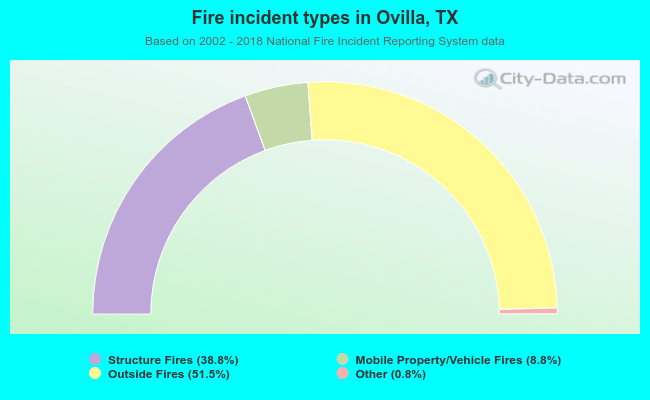 When looking into fire subcategories, the most reports belonged to: Outside Fires (51.5%), and Structure Fires (38.8%).