Orange: Fire Incidents, New Jersey (NJ)
Where are fire incidents reported in Orange, NJ
Something went wrong! Please refresh the page.
| Fire incidents reported | |
|---|---|
| Sreet name | Count |
| CENTRAL AVE | 344 |
| MAIN ST | 242 |
| OAKWOOD AVE | 232 |
| LINCOLN AVE | 224 |
| HIGH ST | 208 |
| CENTER ST | 184 |
| PARK AVE | 176 |
| THOMAS BLVD | 144 |
| WILLIAM ST | 126 |
| SCOTLAND RD | 114 |
| DAY ST | 96 |
| CLEVELAND ST | 82 |
| ESSEX AVE | 72 |
| CENTRAL AVE | 60 |
| VALLEY ST | 56 |
| JEFFERSON ST | 54 |
| REYNOLDS TER | 48 |
| CENTRAL PL | 44 |
| HICKORY ST | 44 |
| TREMONT AVE | 42 |
| HILLYER ST | 40 |
| BERKELEY AVE | 36 |
| PARK ST | 36 |
| PARROW ST | 36 |
| SNYDER ST | 34 |
| RIDGE ST | 32 |
| VOSE AVE | 32 |
| HIGHLAND AVE | 30 |
| LAWNRIDGE RD | 30 |
| PARK AVE | 30 |
2003 - 2018 National Fire Incident Reporting System (NFIRS) incidents
- Incident types reported to NFIRS in Orange, NJ
- 2,44226.3%Rescue & EMS
- 2,33025.1%Fire
- 2,19923.6%Hazardous Condition
- 1,12312.1%False Alarm
- 95910.3%Service Call
- 1992.1%Good Intent Call
- 310.3%Special Incident
- 150.2%Overpressure Rupture
- Fire incident types reported to NFIRS in Orange, NJ
- 1,92482.6%Structure Fires
- 2119.1%Outside Fires
- 1757.5%Mobile Property/Vehicle Fires
- 200.9%Other
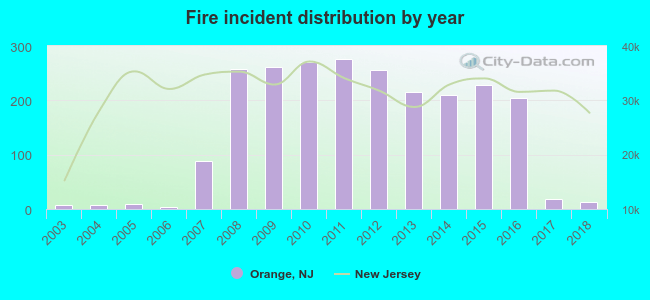 According to the data from the years 2003 - 2018 the average number of fire incidents per year is 146. The highest number of reported fire incidents - 276 took place in 2011, and the least - 4 in 2006. The data has a rising trend.
The average number of yearly fire incidents per 10k residents in Orange, NJ compared to nearest cities:
(Note: Based on data for the last 3 years, including only cities with population 5,000 and above)
| Orange: | 24.7 |
| East Orange: | 48.4 |
| West Orange: | 32.6 |
| South Orange: | 24.3 |
| Irvington: | 26.2 |
| Glen Ridge: | 15.6 |
| Maplewood: | 42.0 |
| Bloomfield: | 31.3 |
| Newark: | 41.2 |
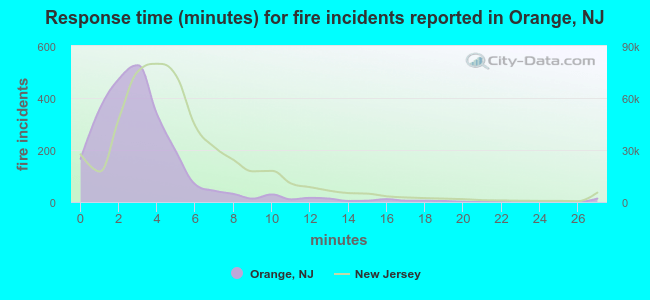 The median response time based on all reported fire incidents is 3 minutes. This is lower compared to the state median value.
The median response time in Orange, NJ compared to nearest cities:
(Note: Based on data for all years, including only cities with at least 500 fire incidents)
| Orange: | 3 minutes |
| East Orange: | 4 minutes |
| West Orange: | 5 minutes |
| South Orange: | 3 minutes |
| Irvington: | 3 minutes |
| Maplewood: | 3 minutes |
| Bloomfield: | 2 minutes |
| Newark: | 3 minutes |
| Montclair: | 3 minutes |
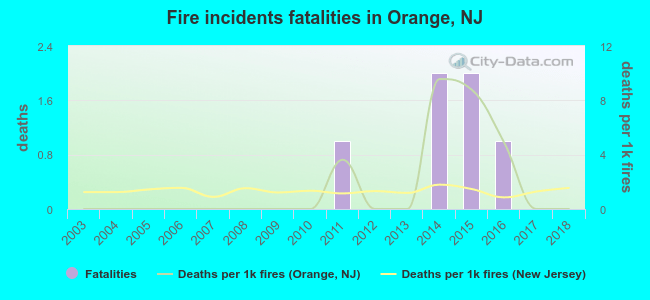 Based on the reports from the years 2003 - 2018 the average number of fire-related fatalities per year is 0. The highest number of reported deaths - 2 took place in 2014, and the lowest - 0 in 2003. The data has a constant trend.
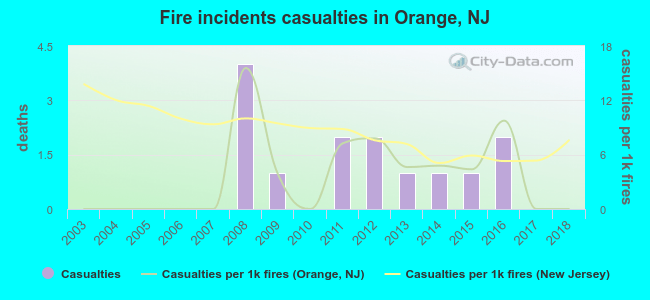 According to the data from the years 2003 - 2018 the average number of fire-related yearly casualties is 1. The highest number of reported injuries - 4 took place in 2008, and the lowest - 0 in 2003. The data has a constant trend.
The average number of injuries per 1,000 fire incidents is 4. This indicator was the highest - 16 in 2008, and the lowest 0 in 2003. The trend for injuries per 1,000 fire incidents is rising. Compared to the New Jersey value the number of casualties per 1,000 incidents is lower.
According to the data from the years 2003 - 2018 the average number of fire-related yearly casualties is 1. The highest number of reported injuries - 4 took place in 2008, and the lowest - 0 in 2003. The data has a constant trend.
The average number of injuries per 1,000 fire incidents is 4. This indicator was the highest - 16 in 2008, and the lowest 0 in 2003. The trend for injuries per 1,000 fire incidents is rising. Compared to the New Jersey value the number of casualties per 1,000 incidents is lower.Casualties per 1,000 incidents in Orange, NJ compared to nearest cities:
(Note: Based on data for all years, including only cities with at least 500 fire incidents)
| Orange: | 6.0 |
| East Orange: | 10.9 |
| West Orange: | 10.1 |
| South Orange: | 8.9 |
| Irvington: | 15.3 |
| Maplewood: | 18.6 |
| Bloomfield: | 9.9 |
| Newark: | 5.7 |
| Montclair: | 14.0 |
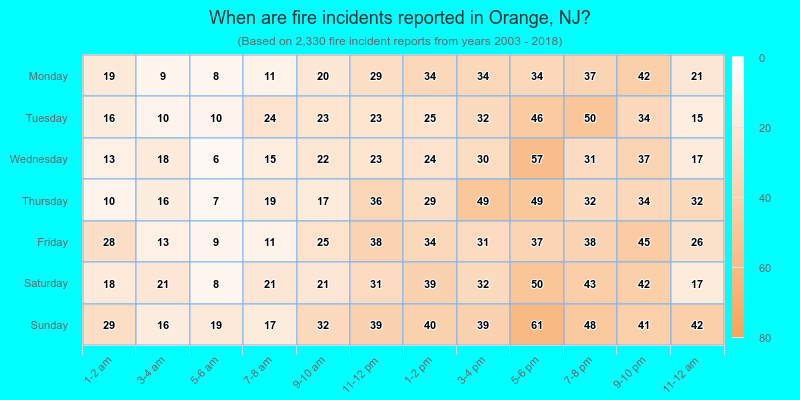
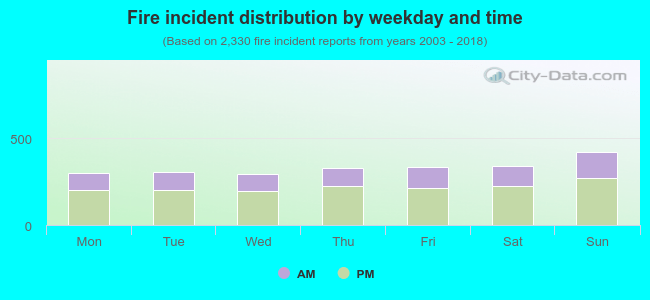 34.3% incidents where reported in the morning and 65.7% in the evening. The most fires (18.2%) took place on Sunday, and the least (12.6%) on Wednesday.
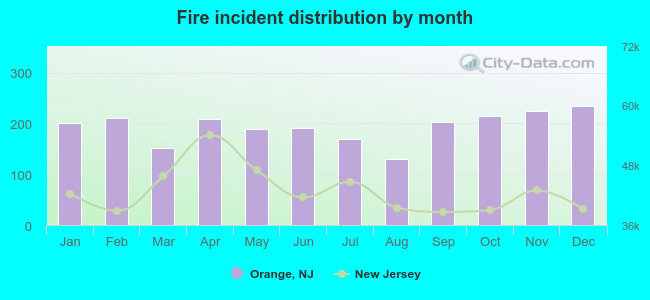 Based on the 2,330 fire incident reports from years 2003 - 2018 most fires (10.1%) took place during December, and the least (5.6%) in August.
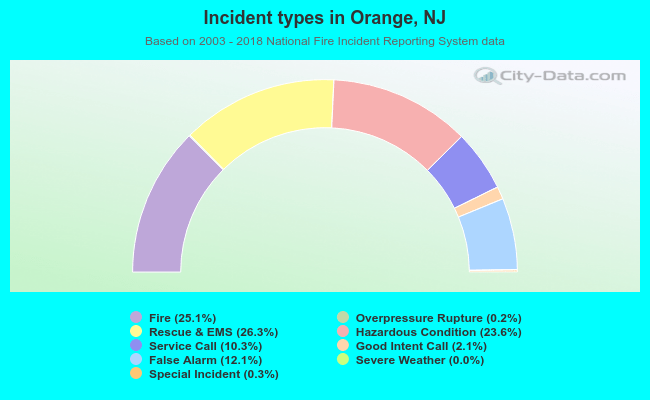 Out of all 9,299 cases reported during the years 2003 - 2018, the most belonged to the categories: Rescue & EMS (26.3%), Fire (25.1%), and Hazardous Condition (23.6%).
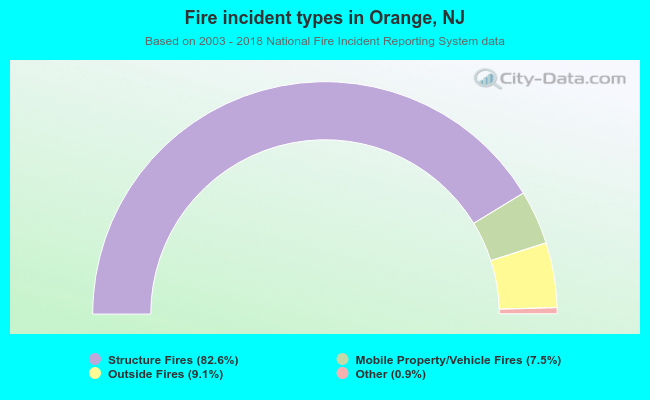 When looking into fire subcategories, the most incidents belonged to: Structure Fires (82.6%), and Outside Fires (9.1%).