North Highlands: Fire Incidents, California (CA)
Where are fire incidents reported in North Highlands, CA
Something went wrong! Please refresh the page.
| Fire incidents reported | |
|---|---|
| Sreet name | Count |
| ROSEVILLE RD | 230 |
| OAKHOLLOW DR | 162 |
| WATT AV | 142 |
| WATT | 124 |
| ELKHORN BL | 118 |
| 34TH ST | 82 |
| 24TH ST | 76 |
| 26TH ST | 74 |
| ELKHORN | 74 |
| 32ND ST | 68 |
| HARRISON ST | 68 |
| JACKSON ST | 66 |
| MADISON | 66 |
| FREEDOM PARK DR | 58 |
| LARCHMONT DR | 56 |
| I ST | 52 |
| MADISON AV | 48 |
| A ST | 44 |
| ANTELOPE RD | 42 |
| GALBRATH DR | 42 |
| DON JULIO BL | 40 |
| GEORGIA DR | 38 |
| WALERGA RD | 38 |
| DON JULIO | 36 |
| GILMAN WY | 36 |
| AIRBASE DR | 34 |
| POPLAR BL | 34 |
| 22ND ST | 32 |
| HAVEN DR | 32 |
| Q ST | 32 |
2005 - 2018 National Fire Incident Reporting System (NFIRS) incidents
- Incident types reported to NFIRS in North Highlands, CA
- 17,80971.3%Rescue & EMS
- 2,76911.1%Good Intent Call
- 1,8477.4%Fire
- 1,3985.6%Service Call
- 6022.4%Hazardous Condition
- 5082.0%False Alarm
- 310.1%Special Incident
- Fire incident types reported to NFIRS in North Highlands, CA
- 1,03756.1%Outside Fires
- 35619.3%Structure Fires
- 31116.8%Mobile Property/Vehicle Fires
- 1437.7%Other
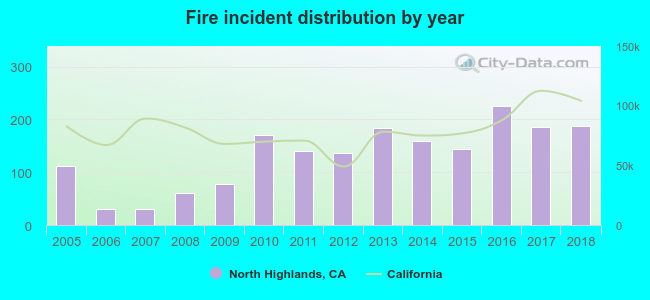 According to the data from the years 2005 - 2018 the average number of fires per year is 132. The highest number of reported fires - 226 took place in 2016, and the least - 30 in 2006. The data has a rising trend.
The average number of yearly fire incidents per 10k residents in North Highlands, CA compared to nearest cities:
(Note: Based on data for the last 3 years, including only cities with population 5,000 and above)
| North Highlands: | 46.8 |
| Antelope: | 11.7 |
| Carmichael: | 16.0 |
| Rio Linda: | 39.7 |
| Citrus Heights: | 28.1 |
| Elverta: | 94.1 |
| Fair Oaks: | 14.0 |
| Roseville: | 22.8 |
| Mather: | 36.7 |
 The median response time based on all reported fire incidents is 5 minutes. This is lower than the state median value.
The median response time in North Highlands, CA compared to nearest cities:
(Note: Based on data for all years, including only cities with at least 500 fire incidents)
| North Highlands: | 5 minutes |
| Antelope: | 5 minutes |
| Carmichael: | 5 minutes |
| Rio Linda: | 5 minutes |
| Citrus Heights: | 5 minutes |
| Elverta: | 6 minutes |
| Fair Oaks: | 5 minutes |
| Roseville: | 5 minutes |
| Mather: | 6 minutes |
 37.0% incidents where reported in the morning and 63.0% in the evening. The most fires (15.3%) took place on Saturday, and the least (13.0%) on Sunday.
 According to the 1,847 incident reports from years 2005 - 2018 most fires (11.6%) took place during July, and the least (4.8%) in February.
 Out of all 24,979 cases reported during the years 2005 - 2018, the most belonged to the categories: Rescue & EMS (71.3%), Good Intent Call (11.1%), and Fire (7.4%).
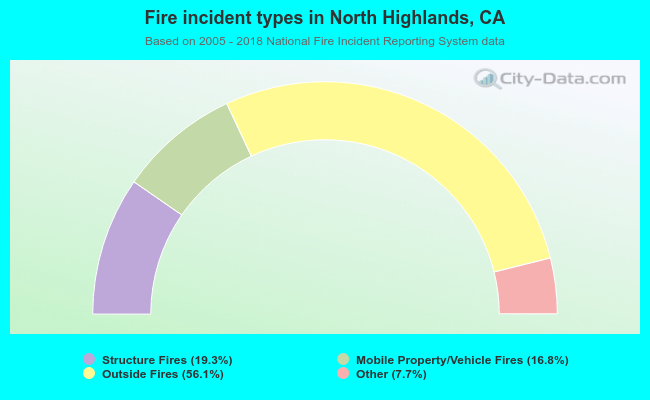 When looking into fire subcategories, the most reports belonged to: Outside Fires (56.1%), and Structure Fires (19.3%).