| Fire incidents reported |
|---|
| Sreet name | Count |
|---|
| FM 2626 | 18 | | HWY 87 N | 10 | | CR 1022 | 8 | | HWY 87 NORTH | 8 | | WOODS COMMUNITY ROAD | 8 | | 190 HWY | 6 | | CNTY RD 4002 | 6 | | CNTY RD 4002 ROAD | 6 | | COUNTY RD 4002 ROAD | 6 | | HWY 190 | 6 | | HWY 190 EAST | 6 | | HWY 190 W | 6 | | HWY 2626 | 6 | | WATHALL RD ROAD | 6 | | 505 LOOP | 4 | | 87 N | 4 | | ARTISIAN SPRINGS CP | 4 | | BEAN STREET | 4 | | CNTY RD 1012 ROAD | 4 | | CNTY RD 4012 | 4 | | COLLEGE STREET | 4 | | COUNTY RD 3006 ROAD | 4 | | COURT STREET | 4 | | CR 1072 | 4 | | CR 4002 | 4 |
| | | Fire incidents reported |
|---|
| Sreet name | Count |
|---|
| CR 4012 | 4 | | CR 4181 RD | 4 | | FM 1012 | 4 | | FM RD 1414 ROAD | 4 | | HWY 190 S | 4 | | HWY 87 S HWY | 4 | | JAMESTOWN RD | 4 | | JAMESTOWN RD (FM1012) | 4 | | PUMP STATION RD ROAD | 4 | | WARD STREET ST | 4 | | WASHINGTON ST | 4 | | WOODS COMMUNITY LOOP | 4 | | 0766 FM 1012 | 2 | | 106 BEAN STREET STRE | 2 | | 113 HIGH STREET | 2 | | 11446 NORTH TX HWY 87 | 2 | | 118 COLLEGE ST | 2 | | 135 PR 8330 | 2 | | 190 | 2 | | 190 WEST BROOKSHIRE BROTHERS | 2 | | 213 ANDERSON STREET | 2 | | 2431 CNTY RD 4001 | 2 | | 2552 FARM RD 2626 | 2 | | 275 C.R. 4060 | 2 | | |
|
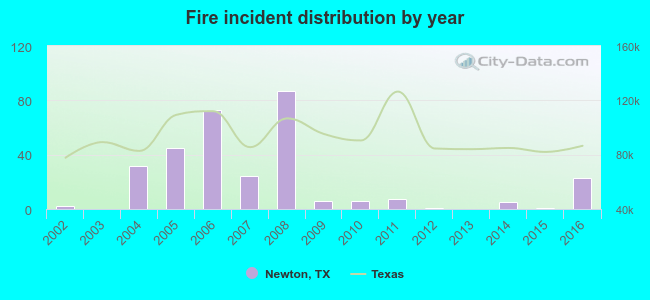 According to the data from the years 2002 - 2016 the average number of fire incidents per year is 21. The highest number of reported fires - 87 took place in 2008, and the least - 0 in 2003. The data has a growing trend.
 33.3% incidents where reported in the morning and 66.7% in the evening. The most fires (20.2%) took place on Saturday, and the least (10.6%) on Friday.
 Based on the 312 reports from years 2002 - 2016 most fires (13.1%) took place during July, and the least (5.4%) in December.
 Out of all 323 cases reported during the years 2002 - 2016, the most belonged to the categories: Fire (96.6%), Overpressure Rupture (1.2%), and Hazardous Condition (1.2%).
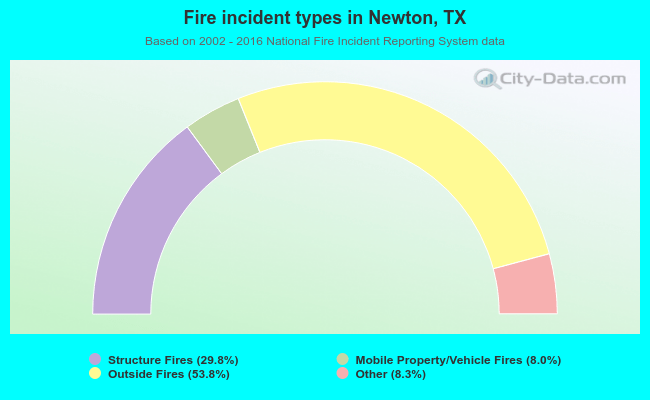 When looking into fire subcategories, the most incidents belonged to: Outside Fires (53.8%), and Structure Fires (29.8%).