Moultonborough: Fire Incidents, New Hampshire (NH)
Where are fire incidents reported in Moultonborough, NH
Something went wrong! Please refresh the page.
|
| |||||||||||||||||||||||||||||||||||||||||||||||||||||||||||||||||||||||||||||||||||||||||||||||||||||||||||||
2006 - 2018 National Fire Incident Reporting System (NFIRS) incidents
- Incident types reported to NFIRS in Moultonborough, NH
- 2,00242.2%Rescue & EMS
- 62813.2%Hazardous Condition
- 57512.1%False Alarm
- 51910.9%Good Intent Call
- 50610.7%Service Call
- 4709.9%Fire
- 380.8%Overpressure Rupture
- Fire incident types reported to NFIRS in Moultonborough, NH
- 26857.0%Structure Fires
- 12827.2%Outside Fires
- 6012.8%Mobile Property/Vehicle Fires
- 143.0%Other
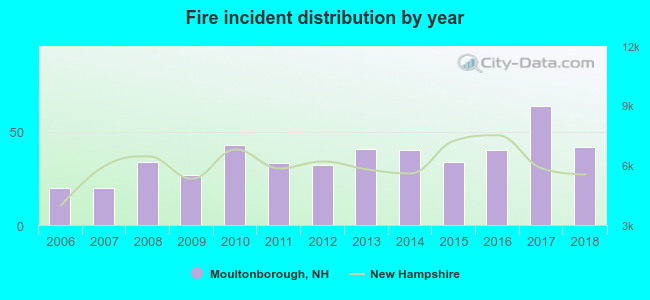 Based on the data from the years 2006 - 2018 the average number of fires per year is 36. The highest number of reported fire incidents - 64 took place in 2017, and the least - 20 in 2006. The data has an increasing trend.
 Based on the data from the years 2006 - 2018 the average number of fire-related yearly casualties is 1. The highest number of injuries - 3 took place in 2012, and the lowest - 0 in 2006. The data has a constant trend.
 33.2% incidents where reported in the morning and 66.8% in the evening. The most fires (18.7%) took place on Friday, and the least (10.6%) on Wednesday.
 Based on the 470 fires from years 2006 - 2018 most fires (11.9%) took place during July, and the least (3.0%) in September.
 Out of all 4,742 cases reported during the years 2006 - 2018, the most belonged to the categories: Rescue & EMS (42.2%), Hazardous Condition (13.2%), and False Alarm (12.1%).
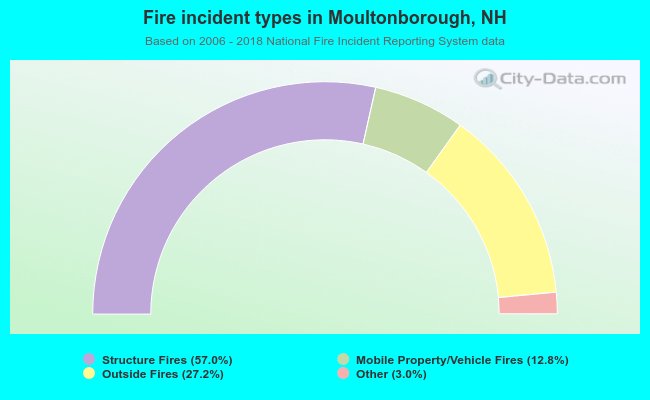 When looking into fire subcategories, the most reports belonged to: Structure Fires (57.0%), and Outside Fires (27.2%).