Monsey: Fire Incidents, New York (NY)
Where are fire incidents reported in Monsey, NY
Something went wrong! Please refresh the page.
| Fire incidents reported | |
|---|---|
| Sreet name | Count |
| ROUTE 59 | 204 |
| N SADDLE RIVER RD | 112 |
| MAPLE AV | 110 |
| MAIN ST | 106 |
| W MAPLE AV | 94 |
| EDWIN LN | 68 |
| ADAR CT | 66 |
| BLAUVELT RD | 66 |
| SUZANNE DR | 66 |
| MONSEY BLVD | 62 |
| JOSHUA CT | 56 |
| CARLTON RD | 52 |
| GROVE ST | 52 |
| GWEN LN | 52 |
| W CENTRAL AV | 52 |
| PARK LN | 50 |
| FRANCIS PL | 44 |
| ELLISH PKWY | 38 |
| ROUTE 306 | 38 |
| SUNRISE DR | 34 |
| BREWER RD | 32 |
| BRIARCLIFF DR | 32 |
| MOUNTAIN AV | 30 |
| NYS THRUWAY | 30 |
| LENORE AV | 28 |
| ALBERT DR | 26 |
| AUGUSTA AV | 26 |
| CAMEO RIDGE RD | 26 |
| REMSEN AV | 26 |
| SADDLE RIVER RD | 26 |
2003 - 2018 National Fire Incident Reporting System (NFIRS) incidents
- Incident types reported to NFIRS in Monsey, NY
- 1,51142.9%Fire
- 89325.4%Hazardous Condition
- 52214.8%False Alarm
- 41911.9%Good Intent Call
- 1253.6%Service Call
- 300.9%Rescue & EMS
- 160.5%Severe Weather
- Fire incident types reported to NFIRS in Monsey, NY
- 72648.0%Structure Fires
- 58238.5%Outside Fires
- 1046.9%Mobile Property/Vehicle Fires
- 996.6%Other
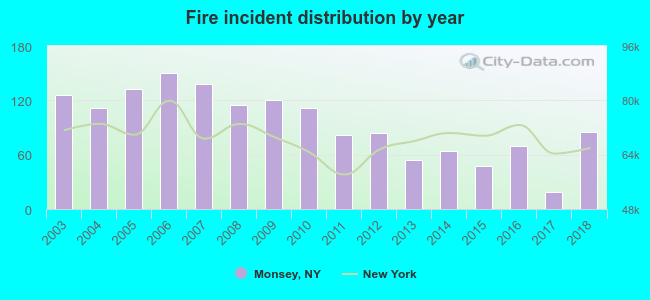 According to the data from the years 2003 - 2018 the average number of fires per year is 94. The highest number of reported fires - 150 took place in 2006, and the least - 19 in 2017. The data has a dropping trend.
The average number of yearly fire incidents per 10k residents in Monsey, NY compared to nearest cities:
(Note: Based on data for the last 3 years, including only cities with population 5,000 and above)
| Monsey: | 31.5 |
| Kaser: | 16.0 |
| Spring Valley: | 13.7 |
| Viola: | 23.8 |
| Hillcrest: | 7.5 |
| New Hempstead: | 30.8 |
| Airmont: | 33.4 |
| New Square: | 16.5 |
| Wesley Hills: | 31.0 |
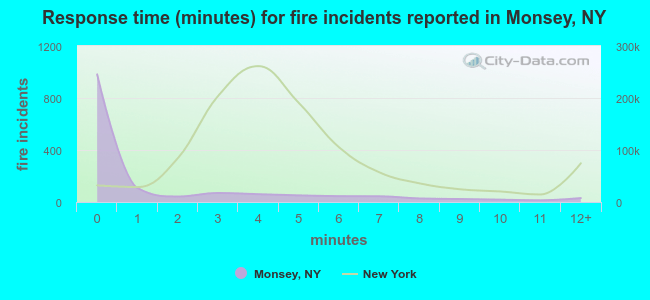 The median response time based on all reported fire incidents is NO DATA minutes. This is !!!ERROR!!! the New York median value.
The median response time in Monsey, NY compared to nearest cities:
(Note: Based on data for all years, including only cities with at least 500 fire incidents)
| Monsey: | 0 minutes |
| Spring Valley: | 5 minutes |
| Airmont: | 4 minutes |
| Nanuet: | 5 minutes |
| New City: | 4 minutes |
| Suffern: | 3 minutes |
| Pomona: | 5 minutes |
| Pearl River: | 4 minutes |
| Ramsey: | 7 minutes |
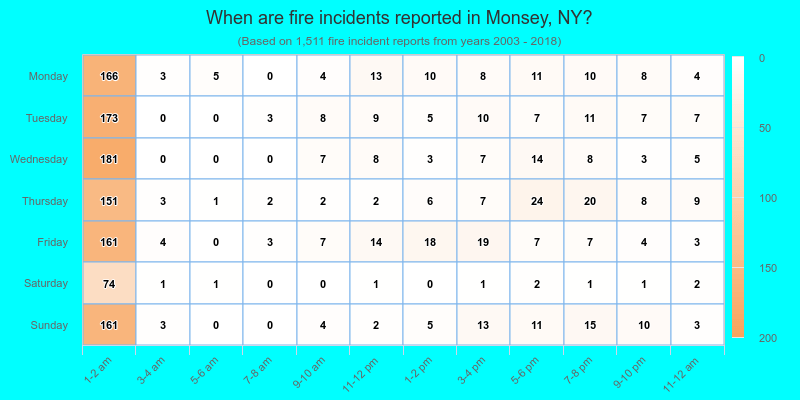
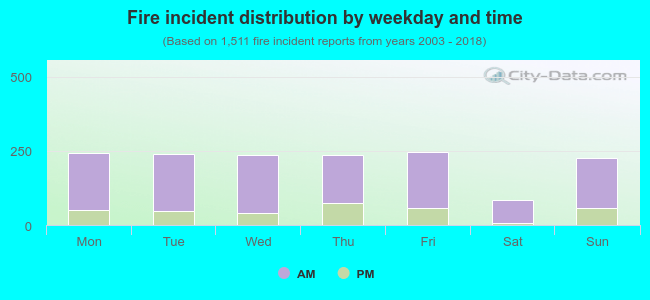 77.9% incidents where reported in the morning and 22.1% in the evening. The most fires (16.3%) took place on Friday, and the least (5.6%) on Saturday.
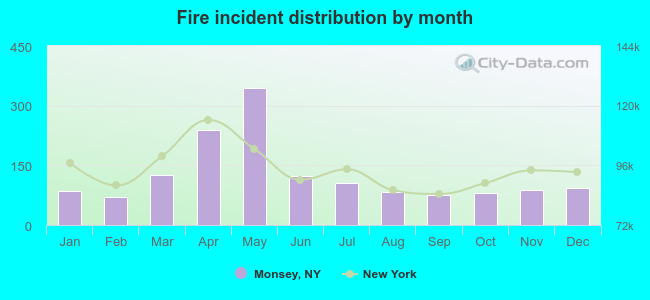 According to the 1,511 fires from years 2003 - 2018 most fires (22.8%) took place during May, and the least (4.6%) in February.
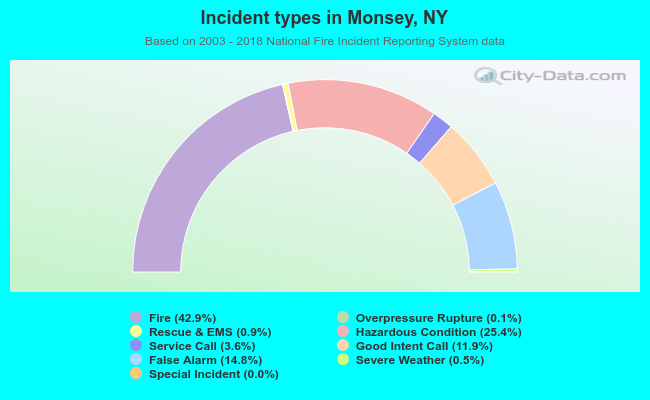 Out of all 3,519 cases reported during the years 2003 - 2018, the most belonged to the categories: Fire (42.9%), Hazardous Condition (25.4%), and False Alarm (14.8%).
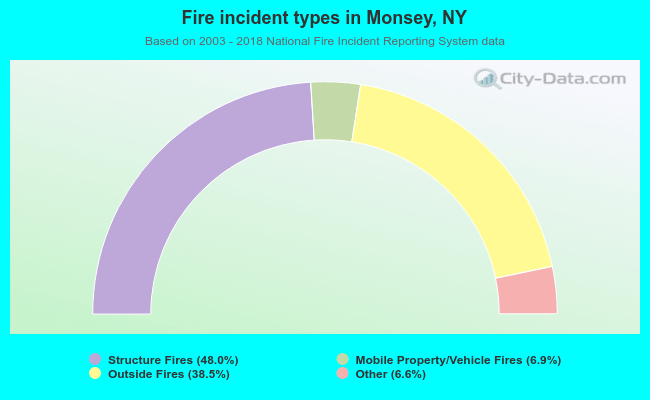 When looking into fire subcategories, the most incidents belonged to: Structure Fires (48.0%), and Outside Fires (38.5%).