Missoula: Fire Incidents, Montana (MT)
Where are fire incidents reported in Missoula, MT
Something went wrong! Please refresh the page.
| Fire incidents reported | |
|---|---|
| Sreet name | Count |
| MULLAN RD | 304 |
| RESERVE ST | 244 |
| BROADWAY ST | 206 |
| RASER DR | 206 |
| HIGHWAY 10 HWY | 160 |
| HIGGINS AVE | 156 |
| INTERSTATE 90 | 142 |
| SOUTH AVE | 126 |
| HIGHWAY 93 HWY | 124 |
| BROOKS ST | 106 |
| BROADWAY | 88 |
| RUSSELL ST | 78 |
| 3RD ST | 76 |
| BIG FLAT RD | 70 |
| 03RD ST | 64 |
| CAMPUS DR | 64 |
| EXPRESSWAY | 62 |
| STEPHENS AVE | 54 |
| COOLEY ST | 52 |
| GRANT CREEK RD | 52 |
| TOOLE AVE | 52 |
| FRONT ST | 46 |
| HIGHWAY 200 HWY | 46 |
| RIVER RD | 46 |
| 7TH ST | 44 |
| CENTRAL AVE | 44 |
| CREGG LANE | 44 |
| MAIN ST | 44 |
| PATTEE CANYON RD | 44 |
| SPRUCE ST | 44 |
| Other | 1,397 |
2002 - 2018 National Fire Incident Reporting System (NFIRS) incidents
- Incident types reported to NFIRS in Missoula, MT
- 30,59755.8%Rescue & EMS
- 8,16614.9%Good Intent Call
- 5,63310.3%Hazardous Condition
- 4,2857.8%Fire
- 3,1375.7%Service Call
- 2,9555.4%False Alarm
- Fire incident types reported to NFIRS in Missoula, MT
- 2,02147.2%Outside Fires
- 1,49334.8%Structure Fires
- 68616.0%Mobile Property/Vehicle Fires
- 852.0%Other
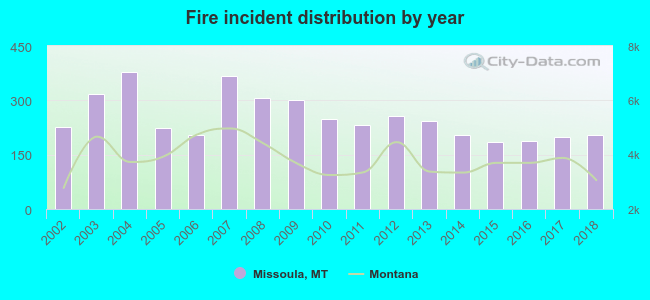 Based on the data from the years 2002 - 2018 the average number of fire incidents per year is 252. The highest number of reported fires - 377 took place in 2004, and the least - 186 in 2015. The data has a dropping trend.
The average number of yearly fire incidents per 10k residents in Missoula, MT compared to nearest cities:
(Note: Based on data for the last 3 years, including only cities with population 5,000 and above)
| Missoula: | 28.2 |
| Anaconda: | 23.2 |
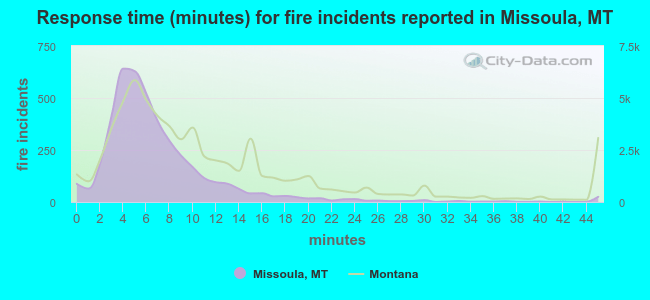 The median response time based on all reported fire incidents is 6 minutes. This is lower than the Montana median value.
The median response time in Missoula, MT compared to nearest cities:
(Note: Based on data for all years, including only cities with at least 500 fire incidents)
| Missoula: | 6 minutes |
| Stevensville: | 9 minutes |
| Hamilton: | 8 minutes |
| Polson: | 8 minutes |
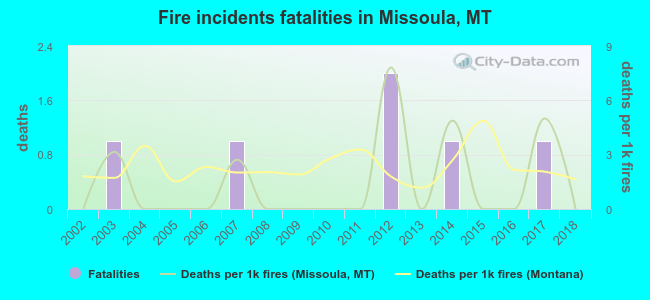 According to the reports from the years 2002 - 2018 the average number of fire-related fatalities per year is 0. The highest number of reported deaths - 2 took place in 2012, and the lowest - 0 in 2002. The data has a constant trend.
The average number of deaths per 1,000 fire incidents is 1. This indicator was the highest - 8 in 2012, and the lowest 0 in 2002. The trend for fatalities per 1,000 fire incidents is constant. Compared to the Montana value the number of fatalities per 1,000 fire incidents is lower.
According to the reports from the years 2002 - 2018 the average number of fire-related fatalities per year is 0. The highest number of reported deaths - 2 took place in 2012, and the lowest - 0 in 2002. The data has a constant trend.
The average number of deaths per 1,000 fire incidents is 1. This indicator was the highest - 8 in 2012, and the lowest 0 in 2002. The trend for fatalities per 1,000 fire incidents is constant. Compared to the Montana value the number of fatalities per 1,000 fire incidents is lower.Deaths per 1,000 incidents in Missoula, MT compared to nearest cities:
(Note: Based on data for all years, including only cities with at least 2,500 fire incidents)
| Missoula: | 1.4 |
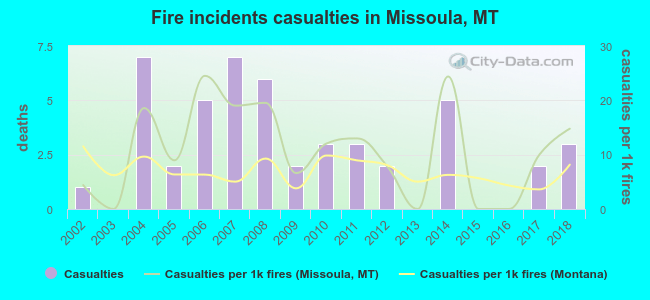 Based on the data from the years 2002 - 2018 the average number of fire-related yearly casualties is 3. The highest number of injuries - 7 took place in 2004, and the lowest - 0 in 2003. The data has a growing trend.
The average number of injuries per 1,000 fire incidents is 11. This indicator was the highest - 25 in 2006, and the lowest 0 in 2003. The trend for injuries per 1,000 incidents is growing. Compared to the state value the number of injuries per 1,000 fires is higher.
Based on the data from the years 2002 - 2018 the average number of fire-related yearly casualties is 3. The highest number of injuries - 7 took place in 2004, and the lowest - 0 in 2003. The data has a growing trend.
The average number of injuries per 1,000 fire incidents is 11. This indicator was the highest - 25 in 2006, and the lowest 0 in 2003. The trend for injuries per 1,000 incidents is growing. Compared to the state value the number of injuries per 1,000 fires is higher.Casualties per 1,000 incidents in Missoula, MT compared to nearest cities:
(Note: Based on data for all years, including only cities with at least 500 fire incidents)
| Missoula: | 11.2 |
| Stevensville: | 2.0 |
| Hamilton: | 14.1 |
| Polson: | 8.2 |
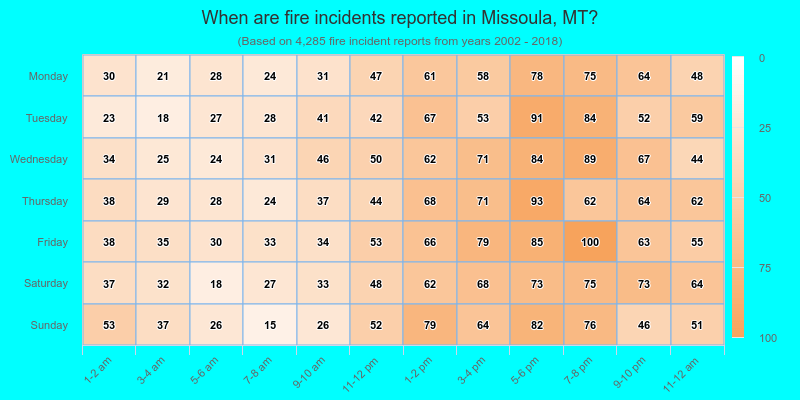
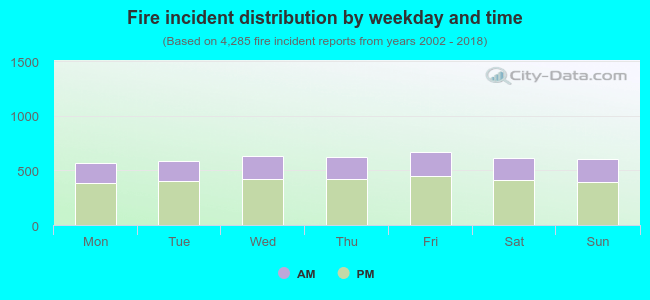 32.6% incidents where reported in the morning and 67.4% in the evening. The most fires (15.7%) took place on Friday, and the least (13.2%) on Monday.
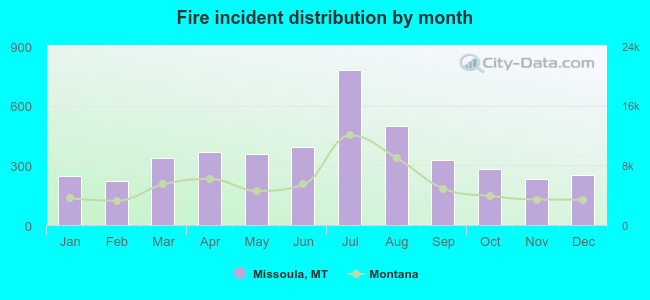 Based on the 4,285 reports from years 2002 - 2018 most fires (18.2%) took place during July, and the least (5.2%) in February.
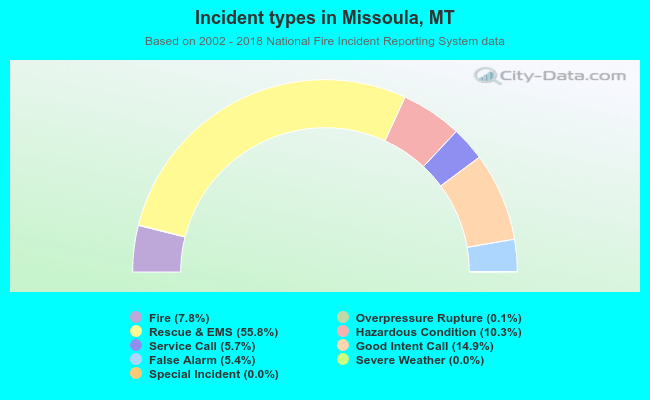 Out of all 54,847 cases reported during the years 2002 - 2018, the most belonged to the categories: Rescue & EMS (55.8%), Good Intent Call (14.9%), and Hazardous Condition (10.3%).
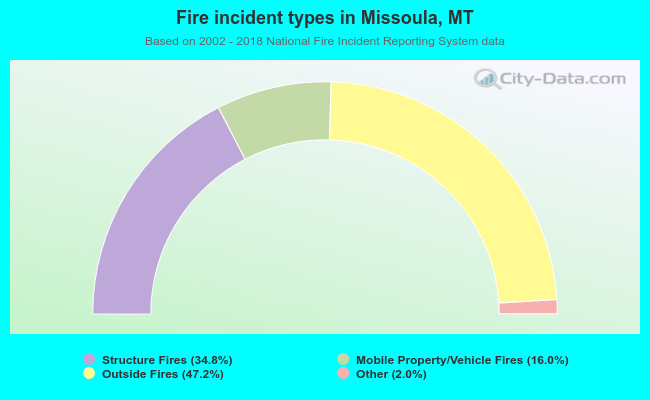 When looking into fire subcategories, the most incidents belonged to: Outside Fires (47.2%), and Structure Fires (34.8%).