| Fire incidents reported |
|---|
| Sreet name | Count |
|---|
| MILLSTONE RD | 14 | | ARROWHEAD WAY | 10 | | STATE ROUTE 33 | 10 | | SWEETMANS LN | 10 | | WOODVILLE RD | 10 | | BAIRD RD | 8 | | BACK BONE HILL RD | 6 | | DUGANS GROVE RD | 6 | | FAWN WAY | 6 | | STAGE COACH RD | 6 | | STAGECOACH RD | 6 | | STILLHOUSE RD | 6 | | AGRESS RD | 4 | | BROOKSIDE DR | 4 | | BROOKSIDE RD | 4 | | CLARK CT | 4 | | CRANBURY BROOK DR | 4 | | DISBROW HILL RD | 4 | | EPHRAIM RD | 4 | | FAIRPLAY RD | 4 | | INTERSTATE 195 EB | 4 | | ROUTE 537 | 4 | | RT. 33 RT | 4 | | STEEPLE CHASE RD | 4 | | 4 BERGAN MILL ROAD | 2 |
| | | Fire incidents reported |
|---|
| Sreet name | Count |
|---|
| 537 CIR | 2 | | AMWELL RD | 2 | | ANDERSON CT | 2 | | APPLEGATE RD | 2 | | BACK BONE HILL | 2 | | BACKBONE HILL | 2 | | BACKBONE HILL RD | 2 | | BERGEN MILLS | 2 | | BERGEN MILLS RD | 2 | | BERGEN MILLS RD RD | 2 | | BITTNER RD | 2 | | CHADWICK RD | 2 | | CLARKSBURG RD | 2 | | CREST CIR | 2 | | CREST CIRCLE | 2 | | CREST CIRCLE DR | 2 | | DEER RUN DR | 2 | | DISBROW HILLS RD | 2 | | DISBROW ROAD | 2 | | FAIR PLAY RD | 2 | | FAWN WAY | 2 | | HALKA WAY | 2 | | HAVLAT CT | 2 | | INDIAN PATH | 2 | | INTERSTATE 195 WB | 2 |
|
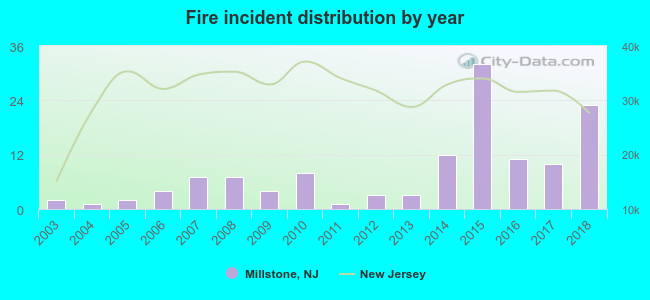 Based on the data from the years 2003 - 2018 the average number of fire incidents per year is 8. The highest number of fires - 32 took place in 2015, and the least - 1 in 2004. The data has a rising trend.
 35.4% incidents where reported in the morning and 64.6% in the evening. The most fires (23.1%) took place on Monday, and the least (6.9%) on Sunday.
 Based on the 130 incident reports from years 2003 - 2018 most fires (13.8%) took place during February, and the least (4.6%) in June.
 Out of all 614 cases reported during the years 2003 - 2018, the most belonged to the categories: Rescue & EMS (25.2%), Fire (21.2%), and Service Call (16.8%).
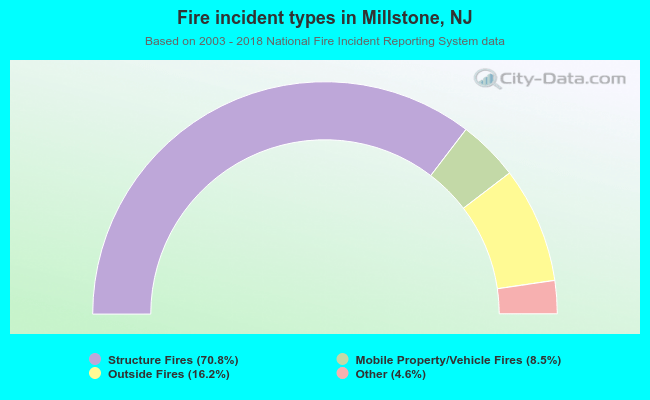 When looking into fire subcategories, the most incidents belonged to: Structure Fires (70.8%), and Outside Fires (16.2%).