Millington: Fire Incidents, Tennessee (TN)
Where are fire incidents reported in Millington, TN
Something went wrong! Please refresh the page.
| Fire incidents reported | |
|---|---|
| Sreet name | Count |
| HIGHWAY 51 | 498 |
| NAVY RD | 254 |
| PLEASANT RIDGE RD | 134 |
| FITE RD | 116 |
| HWY 51 | 108 |
| WEST UNION RD | 98 |
| ROSEMARK RD | 88 |
| BRUNSWICK RD | 86 |
| MUDVILLE RD | 78 |
| WOODSTOCK CUBA RD | 66 |
| SHELBY RD | 64 |
| WARD RD | 62 |
| AUSTIN PEAY HWY | 58 |
| MILLINGTON RD | 56 |
| EASLEY ST | 54 |
| WILKINSVILLE RD | 50 |
| BIG CREEK CHURCH RD | 48 |
| SLEDGE RD | 48 |
| ARMOUR RD | 46 |
| RANKIN BR | 44 |
| BETHUEL RD | 42 |
| LUCY RD | 42 |
| KERRVILLE ROSEMARK RD | 38 |
| CHURCH ST | 36 |
| HIGHWAY 385 | 36 |
| QUITO RD | 36 |
| XXXXX | 36 |
| CRENSHAW RD | 34 |
| HIGHWAY 14 | 34 |
| INDEPENDENCE RD | 34 |
| Other | 825 |
2003 - 2018 National Fire Incident Reporting System (NFIRS) incidents
- Incident types reported to NFIRS in Millington, TN
- 8,50149.5%Rescue & EMS
- 3,24918.9%Fire
- 1,89911.1%Good Intent Call
- 1,2987.6%Service Call
- 1,1816.9%Hazardous Condition
- 9935.8%False Alarm
- 270.2%Overpressure Rupture
- Fire incident types reported to NFIRS in Millington, TN
- 1,68051.7%Outside Fires
- 1,03631.9%Structure Fires
- 44113.6%Mobile Property/Vehicle Fires
- 922.8%Other
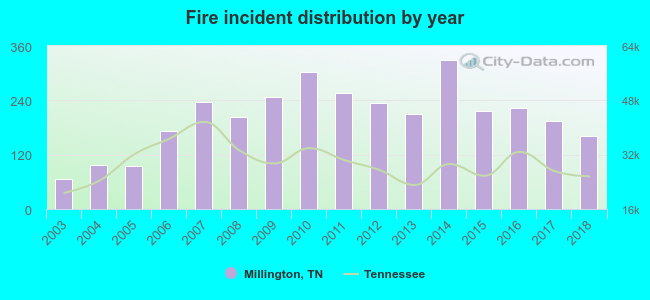 Based on the data from the years 2003 - 2018 the average number of fire incidents per year is 203. The highest number of fire incidents - 330 took place in 2014, and the least - 66 in 2003. The data has an increasing trend.
The average number of yearly fire incidents per 10k residents in Millington, TN compared to nearest cities:
(Note: Based on data for the last 3 years, including only cities with population 5,000 and above)
| Millington: | 173.9 |
| Bartlett: | 19.2 |
| Munford: | 50.1 |
| Atoka: | 78.0 |
| Drummonds: | 38.0 |
| Lakeland: | 21.0 |
| Arlington: | 86.2 |
| Memphis: | 53.0 |
| Germantown: | 22.6 |
 The median response time based on all reported fire incidents is 6 minutes. This is similar to the state median value.
The median response time in Millington, TN compared to nearest cities:
(Note: Based on data for all years, including only cities with at least 500 fire incidents)
| Millington: | 6 minutes |
| Bartlett: | 5 minutes |
| Munford: | 5 minutes |
| Atoka: | 7 minutes |
| Arlington: | 6 minutes |
| Brighton: | 9 minutes |
| Memphis: | 5 minutes |
| Burlison: | 14 minutes |
| Germantown: | 5 minutes |
 According to the data from the years 2003 - 2018 the average number of fire-related fatalities per year is 0. The highest number of reported deaths - 1 took place in 2003, and the lowest - 0 in 2004. The data has a decreasing trend.
The average number of deaths per 1,000 fires is 1. This indicator was the highest - 15 in 2003, and the lowest 0 in 2004. The trend for fatalities per 1,000 incidents is decreasing. Compared to the Tennessee value the number of fatalities per 1,000 incidents is much lower.
According to the data from the years 2003 - 2018 the average number of fire-related fatalities per year is 0. The highest number of reported deaths - 1 took place in 2003, and the lowest - 0 in 2004. The data has a decreasing trend.
The average number of deaths per 1,000 fires is 1. This indicator was the highest - 15 in 2003, and the lowest 0 in 2004. The trend for fatalities per 1,000 incidents is decreasing. Compared to the Tennessee value the number of fatalities per 1,000 incidents is much lower.Deaths per 1,000 incidents in Millington, TN compared to nearest cities:
(Note: Based on data for all years, including only cities with at least 2,500 fire incidents)
| Millington: | 0.9 |
| Memphis: | 4.1 |
| West Memphis: | 2.6 |
| Southaven: | 3.5 |
| Olive Branch: | 1.4 |
| Byhalia: | 1.4 |
| Hernando: | 2.1 |
| Blytheville: | 3.5 |
 Based on the data from the years 2003 - 2018 the average number of fire-related casualties per year is 1. The highest number of reported injuries - 5 took place in 2003, and the lowest - 0 in 2004. The data has a declining trend.
The average number of injuries per 1,000 fire incidents is 10. This indicator was the highest - 76 in 2003, and the lowest 0 in 2004. The trend for casualties per 1,000 incidents is declining. Compared to the Tennessee value the number of casualties per 1,000 fires is similar.
Based on the data from the years 2003 - 2018 the average number of fire-related casualties per year is 1. The highest number of reported injuries - 5 took place in 2003, and the lowest - 0 in 2004. The data has a declining trend.
The average number of injuries per 1,000 fire incidents is 10. This indicator was the highest - 76 in 2003, and the lowest 0 in 2004. The trend for casualties per 1,000 incidents is declining. Compared to the Tennessee value the number of casualties per 1,000 fires is similar.
 29.5% incidents where reported in the morning and 70.5% in the evening. The most fires (17.4%) took place on Saturday, and the least (13.2%) on Wednesday.
 Based on the 3,249 fires from years 2003 - 2018 most fires (9.8%) took place during July, and the least (6.2%) in May.
 Out of all 17,178 cases reported during the years 2003 - 2018, the most belonged to the categories: Rescue & EMS (49.5%), Fire (18.9%), and Good Intent Call (11.1%).
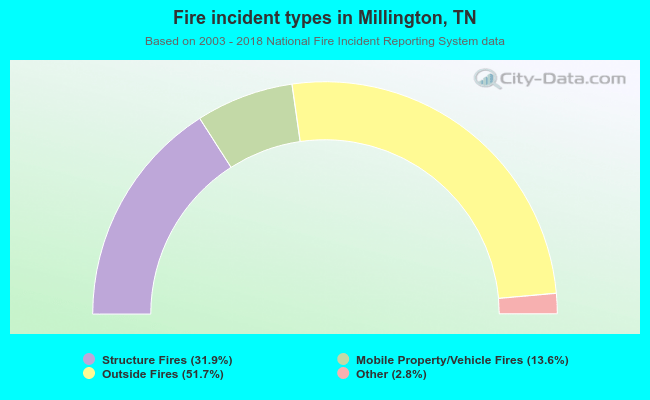 When looking into fire subcategories, the most reports belonged to: Outside Fires (51.7%), and Structure Fires (31.9%).