| Fire incidents reported |
|---|
| Sreet name | Count |
|---|
| 9808 ALDERMAN RD. | 8 | | 11555 SWETT HOLLOW RD. | 6 | | 15996 MILLFIELD RD | 6 | | 9757 MCDOUGAL RD. | 6 | | 10203 ALDERMAN RD | 4 | | 10267 ALDERMAN RD. | 4 | | 1043 BACK ST. | 4 | | 10933 MCDOUGAL RD. | 4 | | 11531 CONCORD CHURCH RD | 4 | | 14701 BIG BAILEY RUN RD. | 4 | | 15414 ST. RTE. 13 NORTH | 4 | | 17609 TRUE TOWN RD. | 4 | | 9848 ALDERMAN RD. | 4 | | MAIN ST | 4 | | ST RTE 13 NORTH | 4 | | STATE ROUTE 13 | 4 | | 10100 MCDOUGAL RD | 2 | | 10101 ALDERMAN RD. | 2 | | 10202 ALDERMAN RD | 2 | | 10205 MCDOUGAL RD | 2 | | 10330 SAND RIDGE RD. | 2 | | 10430 BACK ST | 2 | | 10430 BACK STREET | 2 | | 10440 BACK STREET | 2 | | 10453 SAND RIDGE RD | 2 |
| | | Fire incidents reported |
|---|
| Sreet name | Count |
|---|
| 10490 BACK STREET | 2 | | 10500 TWIST TAIL RD. | 2 | | 10510 MCDOUGAL RD. | 2 | | 10523 BACK ST | 2 | | 10535 TWIST TAIL RD. | 2 | | 1054 BACK ST. | 2 | | 10541 BACK ST. | 2 | | 10556 TWIST TAIL ROAD | 2 | | 10579 BACK ST | 2 | | 10586 BACK STREET | 2 | | 10601 BACK ST | 2 | | 10632 SANDRIDGE RD | 2 | | 10644 BACK ST | 2 | | 10656 TRUETOWN RD | 2 | | 10933 MCDOUGAL RD | 2 | | 11091 MCDOUGAL RD. | 2 | | 11531 CONCORD CHURCH RD. | 2 | | 11545 CARL RD. | 2 | | 11555 SWETT HOLLOW ROAD | 2 | | 11574 SWETT HOLLOW RD | 2 | | 11710 CARL RD | 2 | | 11735 BACK ST | 2 | | 11735 SWETT HOLLOW RD | 2 | | 12208 BEAN HOLLOW RD. | 2 | | |
|
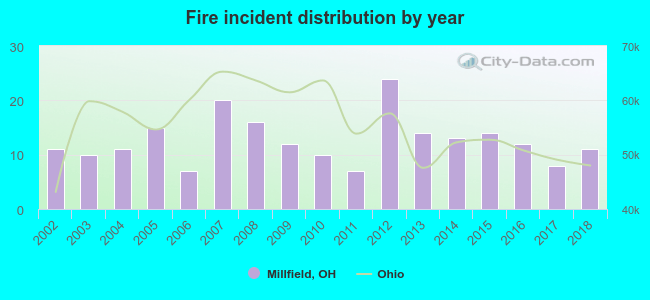 Based on the data from the years 2002 - 2018 the average number of fires per year is 13. The highest number of fires - 24 took place in 2012, and the least - 7 in 2006. The data has a constant trend.
 22.8% incidents where reported in the morning and 77.2% in the evening. The most fires (18.1%) took place on Sunday, and the least (9.8%) on Tuesday.
 Based on the 215 fire incident reports from years 2002 - 2018 most fires (14.4%) took place during April, and the least (3.3%) in September.
 Out of all 627 cases reported during the years 2002 - 2018, the most belonged to the categories: Rescue & EMS (53.6%), Fire (34.3%), and Hazardous Condition (4.0%).
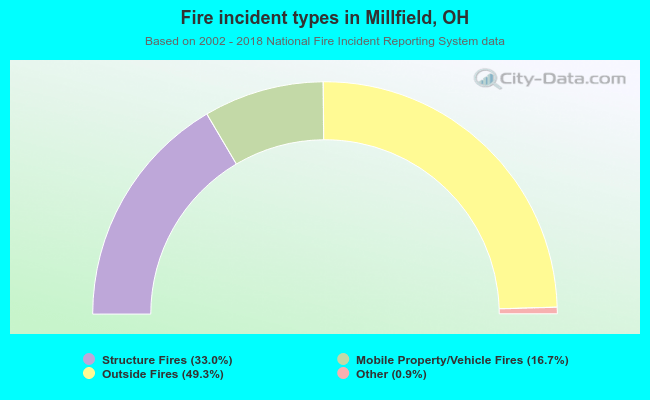 When looking into fire subcategories, the most incidents belonged to: Outside Fires (49.3%), and Structure Fires (33.0%).