Midway: Fire Incidents, Arkansas (AR)
Where are fire incidents reported in Midway, AR
Something went wrong! Please refresh the page.
|
| |||||||||||||||||||||||||||||||||||||||||||||||||||||||||||||||||||||||||||||||||||||||||||||||||||||||||||||
| Other | 101 | |||||||||||||||||||||||||||||||||||||||||||||||||||||||||||||||||||||||||||||||||||||||||||||||||||||||||||||
2002 - 2018 National Fire Incident Reporting System (NFIRS) incidents
- Incident types reported to NFIRS in Midway, AR
- 28745.8%Fire
- 26241.8%Rescue & EMS
- 365.7%Good Intent Call
- 274.3%Hazardous Condition
- 111.8%False Alarm
- 30.5%Service Call
- 10.2%Special Incident
- Fire incident types reported to NFIRS in Midway, AR
- 12844.6%Structure Fires
- 12342.9%Outside Fires
- 238.0%Other
- 134.5%Mobile Property/Vehicle Fires
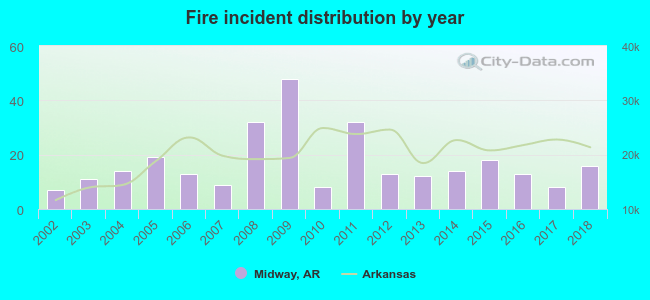 According to the data from the years 2002 - 2018 the average number of fires per year is 17. The highest number of fire incidents - 48 took place in 2009, and the least - 7 in 2002. The data has an increasing trend.
 31.7% incidents where reported in the morning and 68.3% in the evening. The most fires (16.7%) took place on Thursday, and the least (10.1%) on Monday.
 According to the 287 reports from years 2002 - 2018 most fires (15.7%) took place during March, and the least (3.5%) in June.
 Out of all 627 cases reported during the years 2002 - 2018, the most belonged to the categories: Fire (45.8%), Overpressure Rupture (41.8%), and Service Call (5.7%).
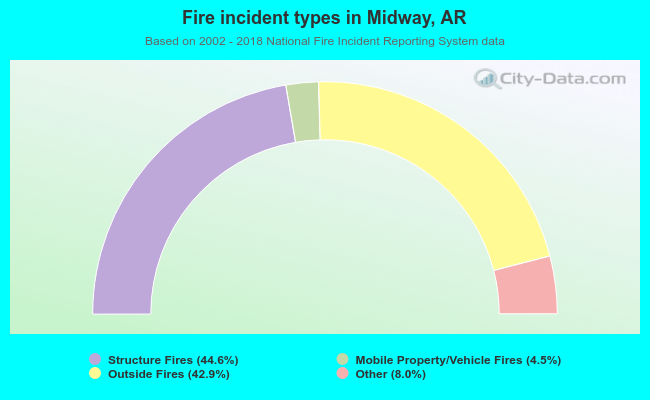 When looking into fire subcategories, the most incidents belonged to: Structure Fires (44.6%), and Outside Fires (42.9%).