Midland: Fire Incidents, Texas (TX)
Where are fire incidents reported in Midland, TX
Something went wrong! Please refresh the page.
| Fire incidents reported | |
|---|---|
| Sreet name | Count |
| MIDLAND DR | 350 |
| LOOP 250 | 322 |
| WALL ST | 216 |
| MIDKIFF RD | 166 |
| A ST | 164 |
| I H 20 | 164 |
| LOOP250 | 132 |
| WADLEY AVE | 132 |
| GARFIELD ST | 118 |
| I20 | 108 |
| ILLINOIS AVE | 108 |
| RANKIN HWY | 98 |
| BIG SPRING ST | 96 |
| HWY 191 | 94 |
| FAIRGROUNDS RD | 84 |
| LAMESA RD | 82 |
| WADLEY AV | 82 |
| ILLINOIS AV | 74 |
| TERRELL ST | 74 |
| ANDREWS HWY | 72 |
| MAIN ST | 72 |
| NEELY AVE | 72 |
| ANDREWS HW | 62 |
| ANETTA DR | 60 |
| CUTHBERT AV | 58 |
| CUTHBERT AVE | 58 |
| HOLIDAY HILL RD | 58 |
| CARVER ST | 56 |
| CAMP DR | 54 |
| THOMASON DR | 50 |
| Other | 1,857 |
2004 - 2018 National Fire Incident Reporting System (NFIRS) incidents
- Incident types reported to NFIRS in Midland, TX
- 35,56363.8%Rescue & EMS
- 6,02410.8%Hazardous Condition
- 5,1939.3%Fire
- 3,6616.6%Good Intent Call
- 2,6904.8%Service Call
- 2,5774.6%False Alarm
- Fire incident types reported to NFIRS in Midland, TX
- 2,93056.4%Outside Fires
- 1,48228.5%Structure Fires
- 75314.5%Mobile Property/Vehicle Fires
- 280.5%Other
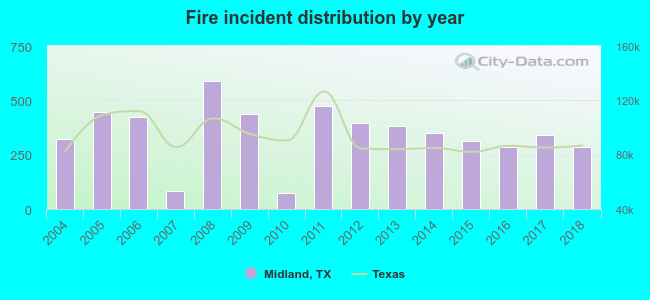 According to the data from the years 2004 - 2018 the average number of fire incidents per year is 346. The highest number of reported fire incidents - 589 took place in 2008, and the least - 74 in 2010. The data has a declining trend.
The average number of yearly fire incidents per 10k residents in Midland, TX compared to nearest cities:
(Note: Based on data for the last 3 years, including only cities with population 5,000 and above)
| Midland: | 23.6 |
| Odessa: | 55.7 |
| West Odessa: | 36.0 |
| Andrews: | 141.4 |
| Big Spring: | 67.3 |
| Lamesa: | 108.8 |
| Monahans: | 22.3 |
| Seminole: | 2.8 |
| Brownfield: | 72.7 |
 The median response time based on all reported fire incidents is 6 minutes. This is about the same as the state median value.
The median response time in Midland, TX compared to nearest cities:
(Note: Based on data for all years, including only cities with at least 500 fire incidents)
| Midland: | 6 minutes |
| Odessa: | 6 minutes |
| Andrews: | 13 minutes |
| Big Spring: | 7 minutes |
| Lamesa: | 6 minutes |
| Monahans: | 5 minutes |
| Jal: | 15 minutes |
| Eunice: | 11 minutes |
| Colorado City: | 6 minutes |
 Based on the reports from the years 2004 - 2018 the average number of fire-related fatalities per year is 1. The highest number of deaths - 4 took place in 2004, and the lowest - 0 in 2007. The data has a decreasing trend.
The average number of fatalities per 1,000 fires is 4. This indicator was the highest - 14 in 2010, and the lowest 0 in 2007. The trend for deaths per 1,000 fires is dropping. Compared to the state value the number of fatalities per 1,000 incidents is much higher.
Based on the reports from the years 2004 - 2018 the average number of fire-related fatalities per year is 1. The highest number of deaths - 4 took place in 2004, and the lowest - 0 in 2007. The data has a decreasing trend.
The average number of fatalities per 1,000 fires is 4. This indicator was the highest - 14 in 2010, and the lowest 0 in 2007. The trend for deaths per 1,000 fires is dropping. Compared to the state value the number of fatalities per 1,000 incidents is much higher.Deaths per 1,000 incidents in Midland, TX compared to nearest cities:
(Note: Based on data for all years, including only cities with at least 2,500 fire incidents)
| Midland: | 4.0 |
| Odessa: | 1.7 |
| Andrews: | 1.1 |
| Big Spring: | 0.7 |
| Hobbs: | 1.3 |
| San Angelo: | 1.2 |
 Based on the reports from the years 2004 - 2018 the average number of fire-related yearly casualties is 6. The highest number of injuries - 15 took place in 2013, and the lowest - 0 in 2007. The data has a growing trend.
The average number of injuries per 1,000 fires is 17. This indicator was the highest - 39 in 2013, and the lowest 0 in 2007. The trend for injuries per 1,000 fires is increasing. Compared to the state value the number of injuries per 1,000 fires is much higher.
Based on the reports from the years 2004 - 2018 the average number of fire-related yearly casualties is 6. The highest number of injuries - 15 took place in 2013, and the lowest - 0 in 2007. The data has a growing trend.
The average number of injuries per 1,000 fires is 17. This indicator was the highest - 39 in 2013, and the lowest 0 in 2007. The trend for injuries per 1,000 fires is increasing. Compared to the state value the number of injuries per 1,000 fires is much higher.Casualties per 1,000 incidents in Midland, TX compared to nearest cities:
(Note: Based on data for all years, including only cities with at least 500 fire incidents)
| Midland: | 17.3 |
| Odessa: | 6.5 |
| Andrews: | 9.5 |
| Big Spring: | 1.0 |
| Lamesa: | 5.9 |
| Monahans: | 0.0 |
| Jal: | 0.0 |
| Eunice: | 0.0 |
| Colorado City: | 0.0 |
 27.4% incidents where reported in the morning and 72.6% in the evening. The most fires (16.2%) took place on Sunday, and the least (13.2%) on Friday.
 According to the 5,193 incident reports from years 2004 - 2018 most fires (10.4%) took place during May, and the least (5.8%) in October.
 Out of all 55,761 cases reported during the years 2004 - 2018, the most belonged to the categories: Rescue & EMS (63.8%), Hazardous Condition (10.8%), and Fire (9.3%).
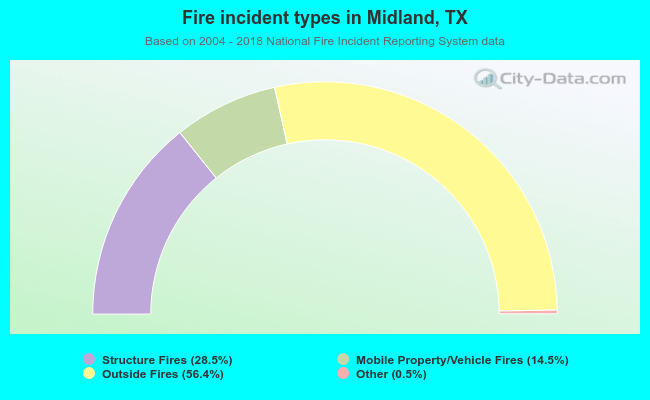 When looking into fire subcategories, the most incidents belonged to: Outside Fires (56.4%), and Structure Fires (28.5%).