Miami Beach: Fire Incidents, Florida (FL)
Where are fire incidents reported in Miami Beach, FL
Something went wrong! Please refresh the page.
|
| |||||||||||||||||||||||||||||||||||||||||||||||||||||||||||||||||||||||||||||||||||||||||||||||||||||||||||||
2009 - 2018 National Fire Incident Reporting System (NFIRS) incidents
- Incident types reported to NFIRS in Miami Beach, FL
- 18,12770.9%Rescue & EMS
- 4,29016.8%False Alarm
- 1,4365.6%Service Call
- 9393.7%Good Intent Call
- 4881.9%Hazardous Condition
- 2140.8%Fire
- 670.3%Special Incident
- Fire incident types reported to NFIRS in Miami Beach, FL
- 8439.3%Outside Fires
- 6932.2%Structure Fires
- 4219.6%Mobile Property/Vehicle Fires
- 198.9%Other
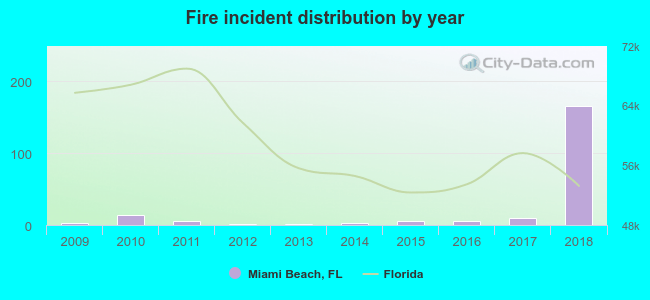 According to the data from the years 2009 - 2018 the average number of fire incidents per year is 21. The highest number of reported fire incidents - 166 took place in 2018, and the least - 1 in 2012. The data has an increasing trend.
The average number of yearly fire incidents per 10k residents in Miami Beach, FL compared to nearest cities:
(Note: Based on data for the last 3 years, including only cities with population 5,000 and above)
| Miami Beach: | 6.6 |
| North Bay Village: | 8.9 |
| Surfside: | 6.7 |
| Miami Shores: | 8.0 |
| Bay Harbor Islands: | 5.0 |
| Miami: | 21.7 |
| North Miami: | 18.8 |
| North Miami Beach: | 12.4 |
| Key Biscayne: | 49.0 |

 38.3% incidents where reported in the morning and 61.7% in the evening. The most fires (17.3%) took place on Tuesday, and the least (11.2%) on Wednesday.
 According to the 214 fire incident reports from years 2009 - 2018 most fires (12.6%) took place during January, and the least (3.3%) in September.
 Out of all 25,566 cases reported during the years 2009 - 2018, the most belonged to the categories: Rescue & EMS (70.9%), False Alarm (16.8%), and Service Call (5.6%).
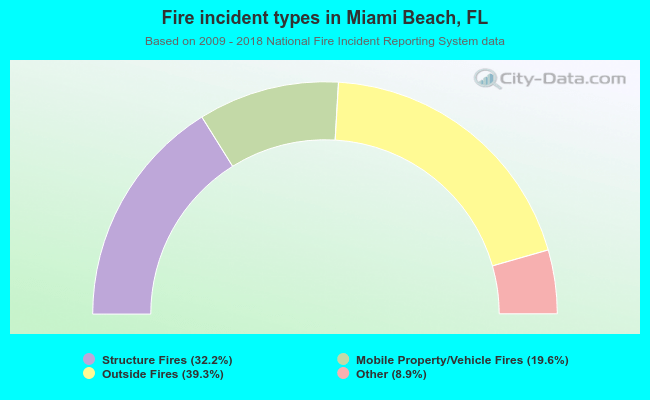 When looking into fire subcategories, the most reports belonged to: Outside Fires (39.3%), and Structure Fires (32.2%).