Merritt Island: Fire Incidents, Florida (FL)
Where are fire incidents reported in Merritt Island, FL
Something went wrong! Please refresh the page.
| Fire incidents reported | |
|---|---|
| Sreet name | Count |
| COURTENAY | 146 |
| MERRITT ISLAND | 86 |
| TROPICAL | 82 |
| BANANA RIVER DR | 52 |
| COURTNEY | 38 |
| COURTENAY PKY | 36 |
| MERRITT ISLAND CSWY | 24 |
| PALMETTO AVE | 22 |
| MERRITT AVE | 20 |
| CRISAFULLI | 18 |
| PLUMOSA | 18 |
| HALL | 16 |
| JORDAN | 16 |
| NORTH COURTENAY | 16 |
| AIRPORT | 12 |
| SEA RAY DR | 12 |
| SKYLARK AVE | 12 |
| 520 | 10 |
| 528 | 10 |
| 700 COURTENAY PKY | 10 |
| BORMAN DR | 10 |
| EAGLE WAY | 10 |
| FORTENBERRY | 10 |
| SYKES CREEK | 10 |
| TROPICAL TRL | 10 |
| 1025 LORING DR | 8 |
| IMPERIAL | 8 |
| KUREK CT | 8 |
| LESTER CT | 8 |
| LIGUSTRUM | 8 |
| Other | 536 |
2003 - 2018 National Fire Incident Reporting System (NFIRS) incidents
- Incident types reported to NFIRS in Merritt Island, FL
- 18,49076.1%Rescue & EMS
- 1,5736.5%Service Call
- 1,2825.3%Fire
- 9944.1%False Alarm
- 9824.0%Good Intent Call
- 9053.7%Hazardous Condition
- 280.1%Special Incident
- Fire incident types reported to NFIRS in Merritt Island, FL
- 65250.9%Outside Fires
- 39330.7%Structure Fires
- 18214.2%Mobile Property/Vehicle Fires
- 554.3%Other
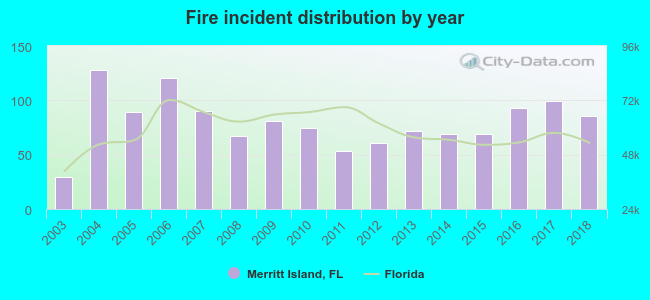 Based on the data from the years 2003 - 2018 the average number of fire incidents per year is 80. The highest number of reported fire incidents - 128 took place in 2004, and the least - 29 in 2003. The data has a rising trend.
The average number of yearly fire incidents per 10k residents in Merritt Island, FL compared to nearest cities:
(Note: Based on data for the last 3 years, including only cities with population 5,000 and above)
| Merritt Island: | 26.7 |
| Cocoa: | 68.3 |
| Rockledge: | 25.2 |
| Cocoa Beach: | 12.0 |
| Cape Canaveral: | 37.8 |
| South Patrick Shores: | 4.5 |
| Satellite Beach: | 27.5 |
| Indian Harbour Beach: | 12.8 |
| Melbourne: | 26.1 |
 The median response time based on all reported fire incidents is 7 minutes. This is comparable to the state median value.
The median response time in Merritt Island, FL compared to nearest cities:
(Note: Based on data for all years, including only cities with at least 500 fire incidents)
| Merritt Island: | 7 minutes |
| Cocoa: | 6 minutes |
| Rockledge: | 5 minutes |
| Cape Canaveral: | 4 minutes |
| Satellite Beach: | 5 minutes |
| Melbourne: | 5 minutes |
| Titusville: | 5 minutes |
| West Melbourne: | 7 minutes |
| Mims: | 8 minutes |
 Based on the data from the years 2003 - 2018 the average number of fire-related yearly casualties is 1. The highest number of reported casualties - 7 took place in 2005, and the lowest - 0 in 2003. The data has a growing trend.
The average number of injuries per 1,000 fires is 9. This indicator was the highest - 79 in 2005, and the lowest 0 in 2003. The trend for injuries per 1,000 incidents is rising. Compared to the state value the number of injuries per 1,000 fire incidents is lower.
Based on the data from the years 2003 - 2018 the average number of fire-related yearly casualties is 1. The highest number of reported casualties - 7 took place in 2005, and the lowest - 0 in 2003. The data has a growing trend.
The average number of injuries per 1,000 fires is 9. This indicator was the highest - 79 in 2005, and the lowest 0 in 2003. The trend for injuries per 1,000 incidents is rising. Compared to the state value the number of injuries per 1,000 fire incidents is lower.Casualties per 1,000 incidents in Merritt Island, FL compared to nearest cities:
(Note: Based on data for all years, including only cities with at least 500 fire incidents)
| Merritt Island: | 10.1 |
| Cocoa: | 6.0 |
| Rockledge: | 18.6 |
| Cape Canaveral: | 4.9 |
| Satellite Beach: | 14.8 |
| Melbourne: | 19.4 |
| Titusville: | 12.2 |
| West Melbourne: | 7.1 |
| Mims: | 12.4 |
 28.9% incidents where reported in the morning and 71.1% in the evening. The most fires (17.1%) took place on Saturday, and the least (12.8%) on Monday.
 Based on the 1,282 fire incident reports from years 2003 - 2018 most fires (12.2%) took place during April, and the least (5.9%) in October.
 Out of all 24,284 cases reported during the years 2003 - 2018, the most belonged to the categories: Rescue & EMS (76.1%), Service Call (6.5%), and Fire (5.3%).
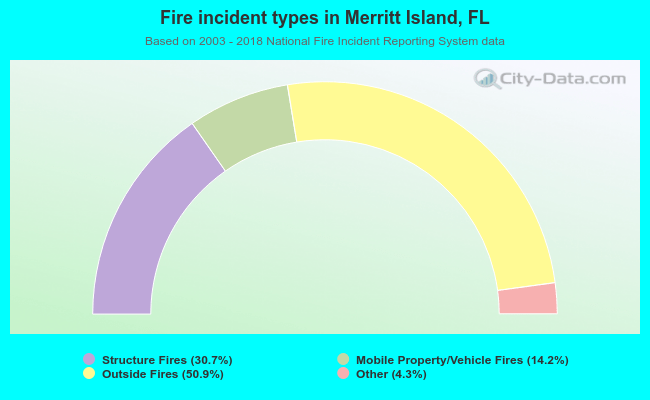 When looking into fire subcategories, the most incidents belonged to: Outside Fires (50.9%), and Structure Fires (30.7%).