Memphis: Fire Incidents, Michigan (MI)
Where are fire incidents reported in Memphis, MI
Something went wrong! Please refresh the page.
|
| |||||||||||||||||||||||||||||||||||||||||||||||||||||||||||||||||||||||||||||||||||||||||||||||||||||||||||||
2002 - 2018 National Fire Incident Reporting System (NFIRS) incidents
- Incident types reported to NFIRS in Memphis, MI
- 45149.8%Rescue & EMS
- 14516.0%Hazardous Condition
- 13314.7%Fire
- 12714.0%Service Call
- 333.6%Good Intent Call
- 70.8%False Alarm
- 70.8%Severe Weather
- 20.2%Special Incident
- Fire incident types reported to NFIRS in Memphis, MI
- 8160.9%Structure Fires
- 2317.3%Outside Fires
- 1813.5%Mobile Property/Vehicle Fires
- 118.3%Other
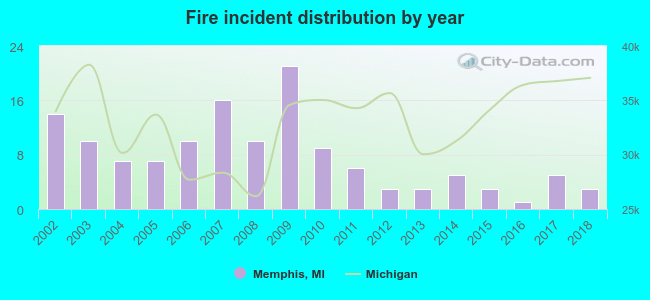 Based on the data from the years 2002 - 2018 the average number of fires per year is 8. The highest number of fires - 21 took place in 2009, and the least - 1 in 2016. The data has a dropping trend.
 41.4% incidents where reported in the morning and 58.6% in the evening. The most fires (19.5%) took place on Sunday, and the least (9.0%) on Thursday.
 According to the 133 fire incident reports from years 2002 - 2018 most fires (15.0%) took place during January, and the least (3.8%) in September.
 Out of all 905 cases reported during the years 2002 - 2018, the most belonged to the categories: Overpressure Rupture (49.8%), Rescue & EMS (16.0%), and Fire (14.7%).
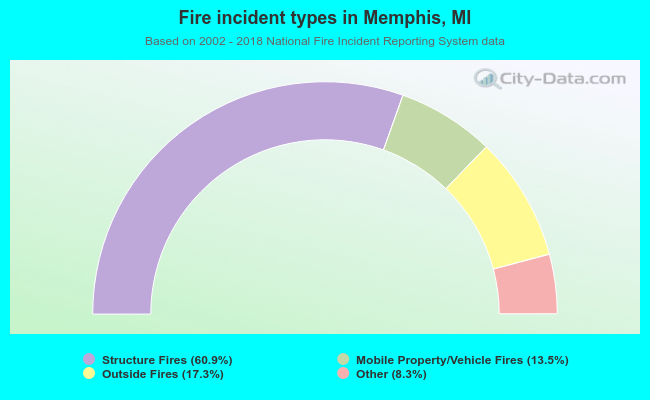 When looking into fire subcategories, the most reports belonged to: Structure Fires (60.9%), and Outside Fires (17.3%).