| Fire incidents reported |
|---|
| Sreet name | Count |
|---|
| BERRYTON RD | 16 | | 325TH RD | 12 | | 325TH | 10 | | 317THSTUBBS RD | 8 | | 325TH CROCO RD | 8 | | JORDAN RD | 8 | | M.M. 160 | 8 | | 163 E 317TH | 6 | | 28821 S CROCO RD | 6 | | 293RD & URISH RD | 6 | | 293RD BERRYTON RD | 6 | | 293RD ST | 6 | | 31181 S JORDAN RD | 6 | | 317TH CALIFORNIA ST | 6 | | 325TH CALIFORNIA RD | 6 | | 333RD STS | 6 | | 341ST | 6 | | 6TH ST QUENEMO | 6 | | K-31 | 6 | | K31 JORDAN RD | 6 | | MILEPOST - INTERSTATE 35 HWY | 6 | | MM 157 I35 | 6 | | MM 162 I35 | 6 | | STANLEY RD | 6 | | 127TH S 6TH QUENEMO | 4 |
| | | Fire incidents reported |
|---|
| Sreet name | Count |
|---|
| 201 SW EMPORIA | 4 | | 238 SE BECK ST | 4 | | 277 TH | 4 | | 277TH ADAMS | 4 | | 285TH | 4 | | 285TH BERRYTON RD | 4 | | 285TH CALIFORNIA RD | 4 | | 293 RD | 4 | | 293RD S BERRYTON RD | 4 | | 301ST ADAMS RD | 4 | | 308 NWLINCOLN ST | 4 | | 31700 S ADAMS RD | 4 | | 317TH JORDAN RD | 4 | | 317TH MORRIL RD | 4 | | 317TH WOODRING RD | 4 | | 32015 S WANAMAKER RD | 4 | | 325TH K31 | 4 | | 333RD RD | 4 | | 341ST FAIRLAWN RD | 4 | | 341ST INDIAN HILLS RD | 4 | | 341ST JORDAN RD | 4 | | 34702 S BERRYTON RD | 4 | | 349 TH | 4 | | 349TH | 4 | | |
|
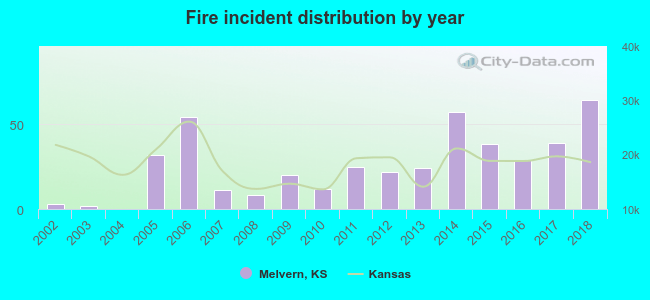 According to the data from the years 2002 - 2018 the average number of fire incidents per year is 26. The highest number of reported fires - 64 took place in 2018, and the least - 0 in 2004. The data has an increasing trend.
 23.2% incidents where reported in the morning and 76.8% in the evening. The most fires (18.2%) took place on Saturday, and the least (11.4%) on Thursday.
 Based on the 440 reports from years 2002 - 2018 most fires (25.0%) took place during March, and the least (1.8%) in December.
 Out of all 622 cases reported during the years 2002 - 2018, the most belonged to the categories: Fire (70.7%), Good Intent Call (11.9%), and Rescue & EMS (11.6%).
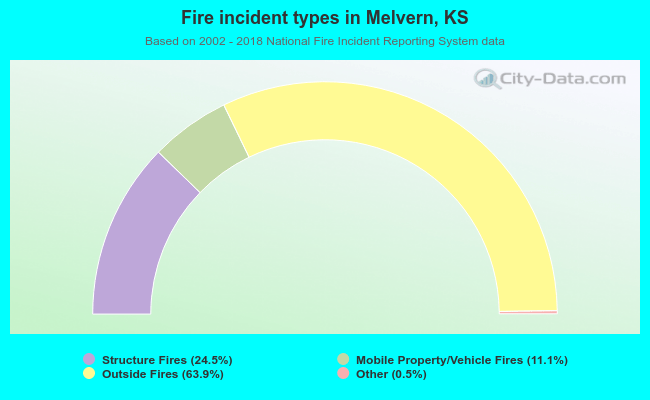 When looking into fire subcategories, the most reports belonged to: Outside Fires (63.9%), and Structure Fires (24.5%).