McAlester: Fire Incidents, Oklahoma (OK)
Where are fire incidents reported in McAlester, OK
Something went wrong! Please refresh the page.
| Fire incidents reported | |
|---|---|
| Sreet name | Count |
| GEORGE NIGH EXPRESSWAY | 96 |
| 379 BLEVINS RD | 52 |
| HARDY SPRINGS RD | 38 |
| MAIN ST | 36 |
| MAIN | 34 |
| CHOCTAW | 32 |
| SEMINOLE AVE | 32 |
| CHICKASAW | 30 |
| HICKORY ST | 30 |
| CARL ALBERT PKWY AVE | 28 |
| US HWY 270 | 28 |
| 2 MILE LANE | 26 |
| POLK AVE | 26 |
| A ST | 24 |
| ADAMS AVE | 24 |
| MONROE AVE | 24 |
| PIERCE AVE | 24 |
| STATE HWY 31 | 24 |
| WASHINGTON AVE | 24 |
| COMANCHE AVE | 22 |
| GEORGE NIGH | 22 |
| MIAMI ST | 22 |
| OSAGE AVE | 22 |
| S GEORGE NIGH | 22 |
| CHEROKEE AVE | 20 |
| ELECTRIC ST | 20 |
| HAYWOOD RD | 20 |
| HWY 69 | 20 |
| 270 WEST HWY | 18 |
| 496 PYLE MTN RD | 18 |
| Other | 2,473 |
2002 - 2018 National Fire Incident Reporting System (NFIRS) incidents
- Incident types reported to NFIRS in McAlester, OK
- 8,52362.3%Rescue & EMS
- 3,33124.4%Fire
- 6734.9%Hazardous Condition
- 4833.5%False Alarm
- 3712.7%Good Intent Call
- 2491.8%Service Call
- 220.2%Special Incident
- 160.1%Overpressure Rupture
- Fire incident types reported to NFIRS in McAlester, OK
- 2,11363.4%Outside Fires
- 63118.9%Structure Fires
- 3219.6%Mobile Property/Vehicle Fires
- 2668.0%Other
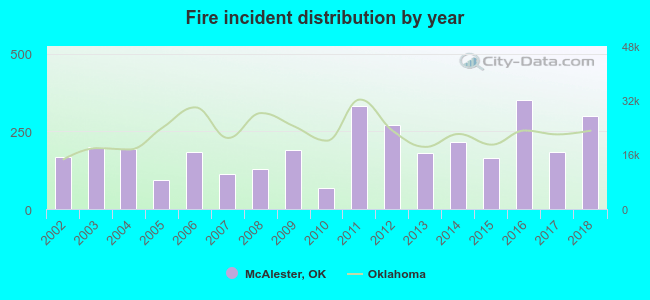 Based on the data from the years 2002 - 2018 the average number of fires per year is 196. The highest number of fires - 350 took place in 2016, and the least - 67 in 2010. The data has a rising trend.
The average number of yearly fire incidents per 10k residents in McAlester, OK compared to nearest cities:
(Note: Based on data for the last 3 years, including only cities with population 5,000 and above)
| McAlester: | 152.4 |
| Henryetta: | 155.7 |
| Holdenville: | 92.3 |
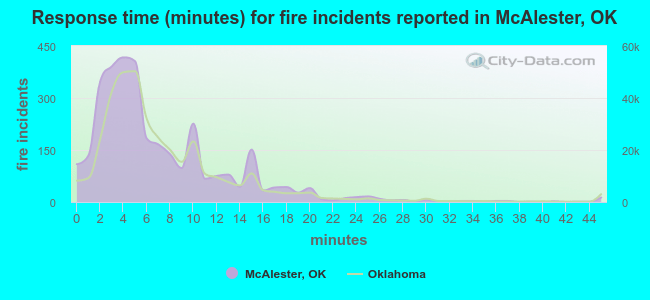 The median response time based on all reported fire incidents is 5 minutes. This is lower than the Oklahoma median value.
The median response time in McAlester, OK compared to nearest cities:
(Note: Based on data for all years, including only cities with at least 500 fire incidents)
| McAlester: | 5 minutes |
| Krebs: | 5 minutes |
| Hartshorne: | 6 minutes |
| Eufaula: | 9 minutes |
| Henryetta: | 7 minutes |
| Holdenville: | 5 minutes |
| Stigler: | 8 minutes |
| Talihina: | 12 minutes |
| Atoka: | 9 minutes |
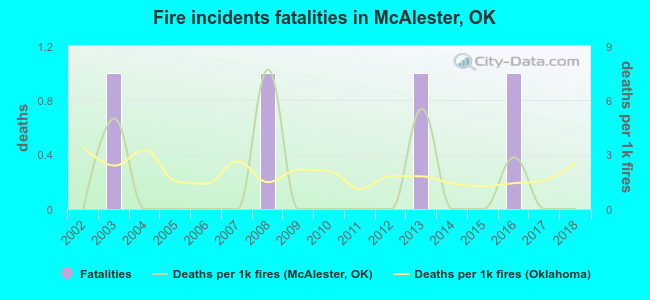 Based on the reports from the years 2002 - 2018 the average number of fire-related fatalities per year is 0. The highest number of reported deaths - 1 took place in 2003, and the lowest - 0 in 2002. The data has a constant trend.
The average number of fatalities per 1,000 fire incidents is 1. This indicator was the highest - 8 in 2008, and the lowest 0 in 2002. The trend for deaths per 1,000 fire incidents is constant. Compared to the Oklahoma value the number of fatalities per 1,000 fires is lower.
Based on the reports from the years 2002 - 2018 the average number of fire-related fatalities per year is 0. The highest number of reported deaths - 1 took place in 2003, and the lowest - 0 in 2002. The data has a constant trend.
The average number of fatalities per 1,000 fire incidents is 1. This indicator was the highest - 8 in 2008, and the lowest 0 in 2002. The trend for deaths per 1,000 fire incidents is constant. Compared to the Oklahoma value the number of fatalities per 1,000 fires is lower.Deaths per 1,000 incidents in McAlester, OK compared to nearest cities:
(Note: Based on data for all years, including only cities with at least 2,500 fire incidents)
| McAlester: | 1.2 |
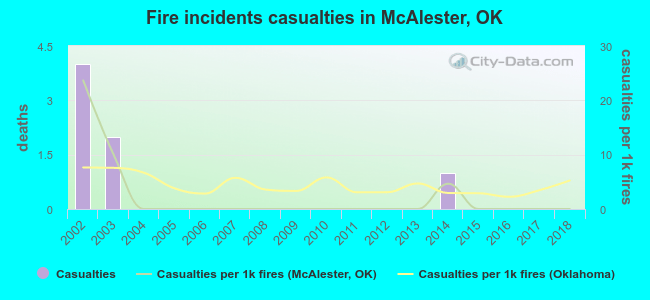 According to the reports from the years 2002 - 2018 the average number of fire-related yearly casualties is 0. The highest number of casualties - 4 took place in 2002, and the lowest - 0 in 2004. The data has a declining trend.
The average number of casualties per 1,000 fires is 2. This indicator was the highest - 24 in 2002, and the lowest 0 in 2004. The trend for casualties per 1,000 fires is dropping. Compared to the Oklahoma value the number of injuries per 1,000 fire incidents is lower.
According to the reports from the years 2002 - 2018 the average number of fire-related yearly casualties is 0. The highest number of casualties - 4 took place in 2002, and the lowest - 0 in 2004. The data has a declining trend.
The average number of casualties per 1,000 fires is 2. This indicator was the highest - 24 in 2002, and the lowest 0 in 2004. The trend for casualties per 1,000 fires is dropping. Compared to the Oklahoma value the number of injuries per 1,000 fire incidents is lower.Casualties per 1,000 incidents in McAlester, OK compared to nearest cities:
(Note: Based on data for all years, including only cities with at least 500 fire incidents)
| McAlester: | 2.1 |
| Krebs: | 0.0 |
| Hartshorne: | 0.0 |
| Eufaula: | 0.0 |
| Henryetta: | 0.0 |
| Holdenville: | 1.0 |
| Stigler: | 0.0 |
| Talihina: | 3.8 |
| Atoka: | 0.0 |
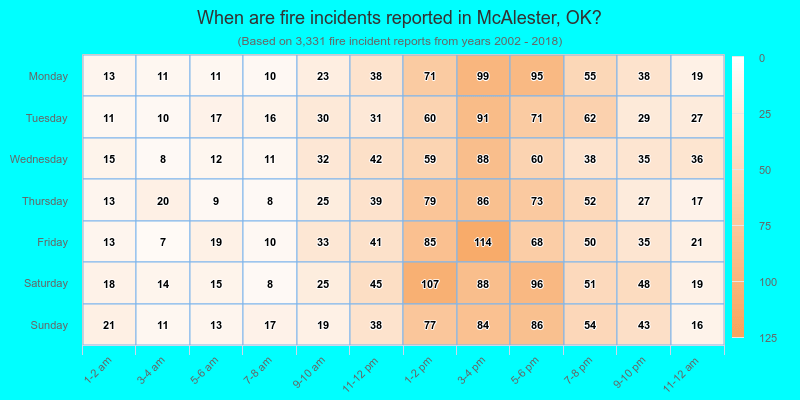
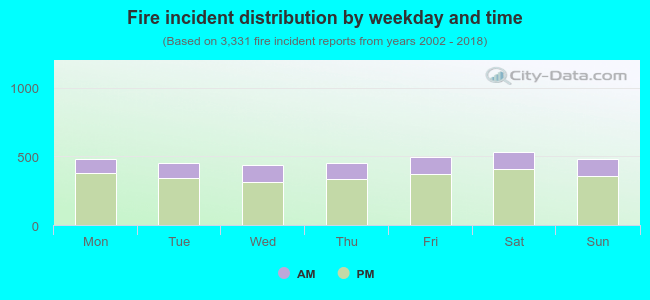 24.7% incidents where reported in the morning and 75.3% in the evening. The most fires (16.0%) took place on Saturday, and the least (13.1%) on Wednesday.
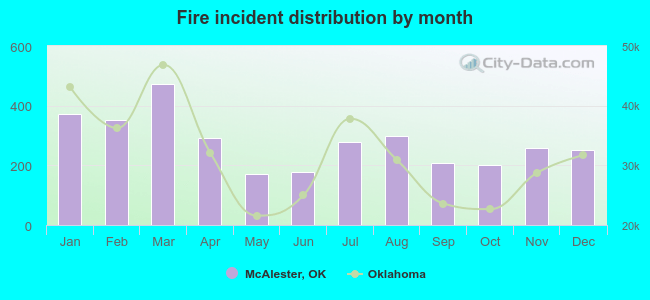 According to the 3,331 fire incidents from years 2002 - 2018 most fires (14.2%) took place during March, and the least (5.1%) in May.
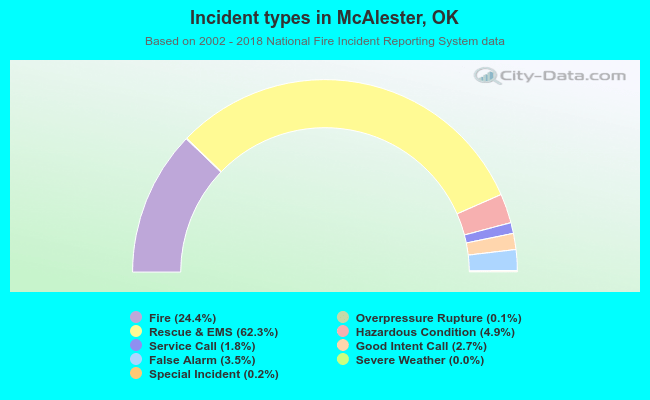 Out of all 13,670 cases reported during the years 2002 - 2018, the most belonged to the categories: Rescue & EMS (62.3%), Fire (24.4%), and Hazardous Condition (4.9%).
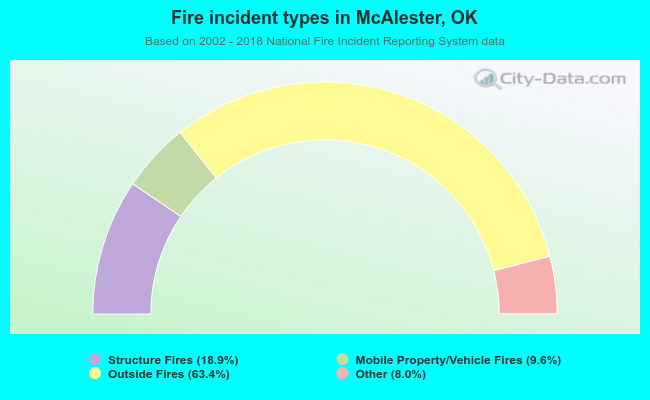 When looking into fire subcategories, the most incidents belonged to: Outside Fires (63.4%), and Structure Fires (18.9%).