Mart: Fire Incidents, Texas (TX)
Where are fire incidents reported in Mart, TX
Something went wrong! Please refresh the page.
|
| |||||||||||||||||||||||||||||||||||||||||||||||||||||||||||||||||||||||||||||||||||||||||||||||||||||||||||||
2002 - 2018 National Fire Incident Reporting System (NFIRS) incidents
- Incident types reported to NFIRS in Mart, TX
- 16250.2%Fire
- 5216.1%Rescue & EMS
- 4012.4%Hazardous Condition
- 309.3%Good Intent Call
- 237.1%False Alarm
- 154.6%Service Call
- 10.3%Overpressure Rupture
- Fire incident types reported to NFIRS in Mart, TX
- 9055.6%Outside Fires
- 4628.4%Structure Fires
- 2213.6%Mobile Property/Vehicle Fires
- 42.5%Other
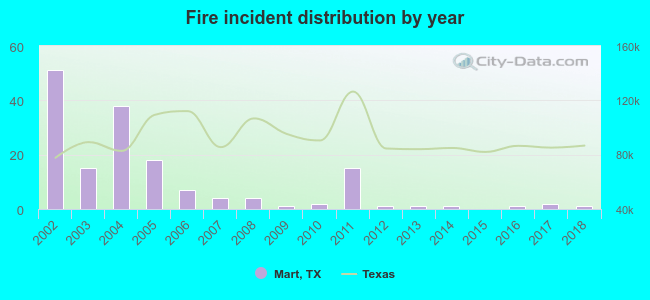 According to the data from the years 2002 - 2018 the average number of fires per year is 10. The highest number of reported fire incidents - 51 took place in 2002, and the least - 0 in 2015. The data has a declining trend.
 24.7% incidents where reported in the morning and 75.3% in the evening. The most fires (19.8%) took place on Friday, and the least (9.9%) on Sunday.
 According to the 162 fire incident reports from years 2002 - 2018 most fires (16.7%) took place during January, and the least (1.2%) in November.
 Out of all 323 cases reported during the years 2002 - 2018, the most belonged to the categories: Fire (50.2%), Rescue & EMS (16.1%), and Hazardous Condition (12.4%).
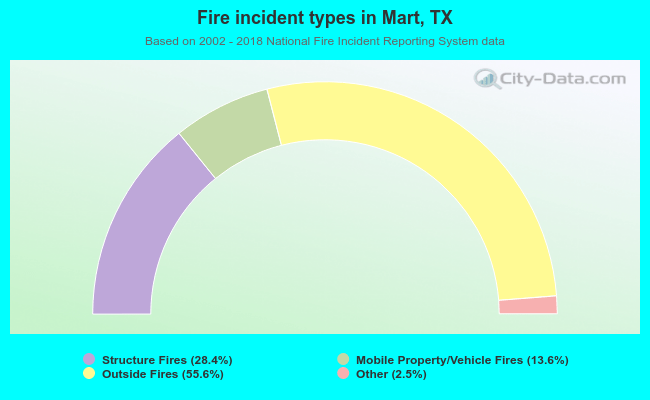 When looking into fire subcategories, the most incidents belonged to: Outside Fires (55.6%), and Structure Fires (28.4%).