Mankato: Fire Incidents, Minnesota (MN)
Where are fire incidents reported in Mankato, MN
Something went wrong! Please refresh the page.
| Fire incidents reported | |
|---|---|
| Sreet name | Count |
| RIVERFRONT DR | 246 |
| WARREN ST | 162 |
| MADISON AVE | 148 |
| 4TH ST | 124 |
| BROAD ST | 108 |
| ADAMS ST | 104 |
| 2ND ST | 100 |
| ELLIS AVE | 96 |
| 5TH ST | 92 |
| MONKS AVE | 88 |
| 3RD AVE | 82 |
| MAYWOOD AVE | 78 |
| JAMES AVE | 66 |
| FRONT ST | 62 |
| MAIN ST | 58 |
| HIGHWAY 14 | 56 |
| HILLTOP LN | 56 |
| STADIUM RD | 54 |
| 6TH ST | 48 |
| HOMESTEAD DR | 48 |
| SUMMIT AVE | 42 |
| VICTORY DR | 40 |
| BALCERZAK DR | 38 |
| GLENWOOD AVE | 38 |
| JAYCEE CT | 38 |
| MOUND AVE | 36 |
| BRIARGATE RD | 34 |
| CAMPUS VIEW ST | 34 |
| CIVIC CENTER PLZ | 34 |
| MOHR DR | 34 |
| Other | 202 |
2002 - 2018 National Fire Incident Reporting System (NFIRS) incidents
- Incident types reported to NFIRS in Mankato, MN
- 10,41651.1%Rescue & EMS
- 2,93514.4%Hazardous Condition
- 2,44612.0%Fire
- 2,26211.1%False Alarm
- 1,5387.5%Service Call
- 7603.7%Good Intent Call
- Fire incident types reported to NFIRS in Mankato, MN
- 1,09044.6%Structure Fires
- 81833.4%Outside Fires
- 46519.0%Mobile Property/Vehicle Fires
- 733.0%Other
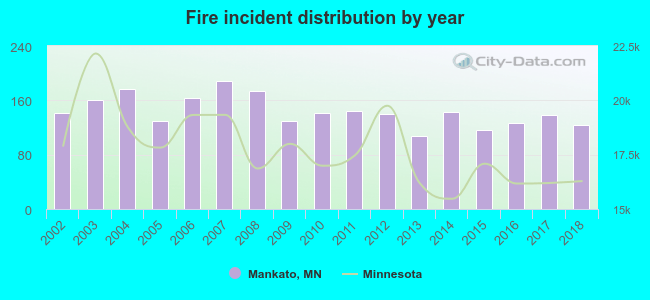 According to the data from the years 2002 - 2018 the average number of fire incidents per year is 144. The highest number of reported fires - 189 took place in 2007, and the least - 108 in 2013. The data has a dropping trend.
The average number of yearly fire incidents per 10k residents in Mankato, MN compared to nearest cities:
(Note: Based on data for the last 3 years, including only cities with population 5,000 and above)
| Mankato: | 32.2 |
| North Mankato: | 15.4 |
| Waseca: | 41.3 |
| New Ulm: | 25.4 |
| New Prague: | 34.0 |
| Belle Plaine: | 25.6 |
| Faribault: | 43.5 |
| Owatonna: | 24.8 |
| Jordan: | 35.7 |
 The median response time based on all reported fire incidents is 5 minutes. This is lower than the state median value.
 According to the data from the years 2002 - 2018 the average number of fire-related yearly casualties is 1. The highest number of injuries - 4 took place in 2014, and the lowest - 0 in 2002. The data has a constant trend.
The average number of injuries per 1,000 fire incidents is 11. This indicator was the highest - 29 in 2017, and the lowest 0 in 2002. The trend for casualties per 1,000 fires is constant. Compared to the Minnesota value the number of injuries per 1,000 fires is similar.
According to the data from the years 2002 - 2018 the average number of fire-related yearly casualties is 1. The highest number of injuries - 4 took place in 2014, and the lowest - 0 in 2002. The data has a constant trend.
The average number of injuries per 1,000 fire incidents is 11. This indicator was the highest - 29 in 2017, and the lowest 0 in 2002. The trend for casualties per 1,000 fires is constant. Compared to the Minnesota value the number of injuries per 1,000 fires is similar.
 35.7% incidents where reported in the morning and 64.3% in the evening. The most fires (17.0%) took place on Saturday, and the least (11.6%) on Tuesday.
 According to the 2,446 fires from years 2002 - 2018 most fires (10.8%) took place during April, and the least (6.0%) in December.
 Out of all 20,398 cases reported during the years 2002 - 2018, the most belonged to the categories: Rescue & EMS (51.1%), Hazardous Condition (14.4%), and Fire (12.0%).
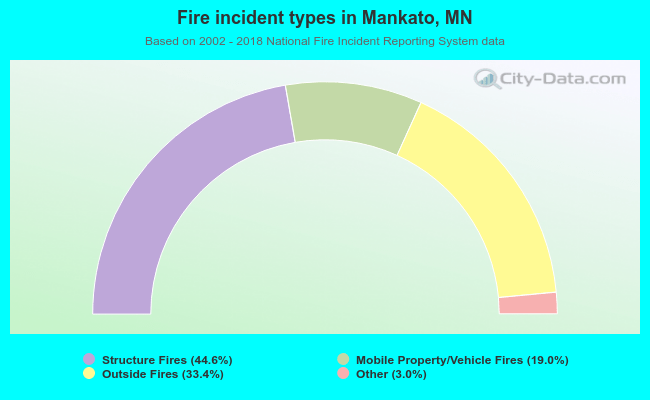 When looking into fire subcategories, the most incidents belonged to: Structure Fires (44.6%), and Outside Fires (33.4%).