Lowell: Fire Incidents, Oregon (OR)
Where are fire incidents reported in Lowell, OR
Something went wrong! Please refresh the page.
|
| |||||||||||||||||||||||||||||||||||||||||||||||||||||||||||||||||||||||||||||||||||||||||||||||||||||||||||||
2002 - 2018 National Fire Incident Reporting System (NFIRS) incidents
- Incident types reported to NFIRS in Lowell, OR
- 72957.0%Rescue & EMS
- 19815.5%Good Intent Call
- 17013.3%Fire
- 15412.0%Hazardous Condition
- 191.5%Service Call
- 100.8%False Alarm
- Fire incident types reported to NFIRS in Lowell, OR
- 7041.2%Structure Fires
- 7041.2%Outside Fires
- 2615.3%Mobile Property/Vehicle Fires
- 42.4%Other
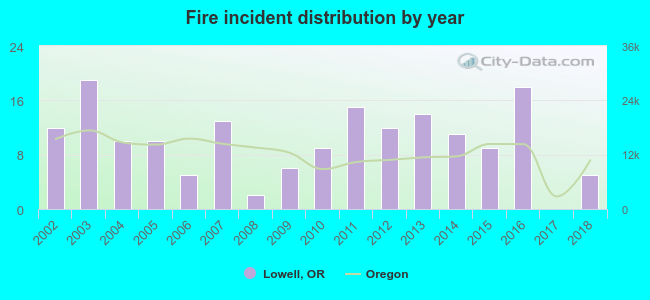 Based on the data from the years 2002 - 2018 the average number of fires per year is 10. The highest number of reported fire incidents - 19 took place in 2003, and the least - 0 in 2017. The data has a declining trend.
 36.5% incidents where reported in the morning and 63.5% in the evening. The most fires (17.6%) took place on Tuesday, and the least (10.0%) on Saturday.
 According to the 170 fire incidents from years 2002 - 2018 most fires (23.5%) took place during July, and the least (2.4%) in December.
 Out of all 1,280 cases reported during the years 2002 - 2018, the most belonged to the categories: Overpressure Rupture (57.0%), Service Call (15.5%), and Fire (13.3%).
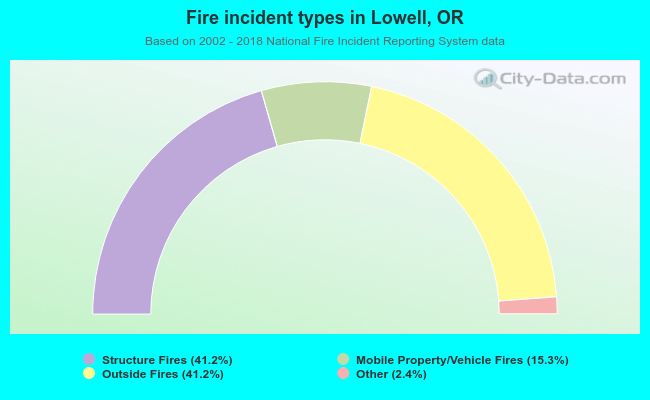 When looking into fire subcategories, the most incidents belonged to: Structure Fires (41.2%), and Outside Fires (41.2%).