Longview: Fire Incidents, Texas (TX)
Where are fire incidents reported in Longview, TX
Something went wrong! Please refresh the page.
| Fire incidents reported | |
|---|---|
| Sreet name | Count |
| COUNTY OF GREGG | 1,132 |
| LOOP 281 | 572 |
| MARSHALL AVE | 388 |
| EASTMAN RD | 370 |
| MCCANN RD | 256 |
| MARSHALL AV | 242 |
| GILMER RD | 200 |
| SH 149 HWY | 196 |
| HIGH ST | 188 |
| JUDSON RD | 188 |
| COTTON ST | 180 |
| PINE TREE RD | 160 |
| GREEN ST | 144 |
| DANA WA | 138 |
| LAKE CHEROKEE LK | 132 |
| LANSING SWITCH RD | 130 |
| YOUNG ST | 120 |
| WHALEY ST | 114 |
| PAGE RD | 112 |
| 968 FM | 106 |
| FM 2011 FM | 106 |
| FM 2906 | 100 |
| GUM SPRINGS RD | 100 |
| COUNTY OF HARRISON | 96 |
| PLEASENT GREEN RD | 92 |
| HWY 31 | 86 |
| ESTES PKWY | 84 |
| 80 HWY | 82 |
| SH 322 HWY | 82 |
| TAMMY LYNN DR | 80 |
| Other | 3,419 |
2003 - 2018 National Fire Incident Reporting System (NFIRS) incidents
- Incident types reported to NFIRS in Longview, TX
- 60,09956.8%Rescue & EMS
- 16,43515.5%Service Call
- 9,3958.9%Fire
- 7,3867.0%Hazardous Condition
- 6,7586.4%Good Intent Call
- 4,3764.1%False Alarm
- 1,1681.1%Special Incident
- Fire incident types reported to NFIRS in Longview, TX
- 4,61249.1%Outside Fires
- 3,16533.7%Structure Fires
- 1,46215.6%Mobile Property/Vehicle Fires
- 1561.7%Other
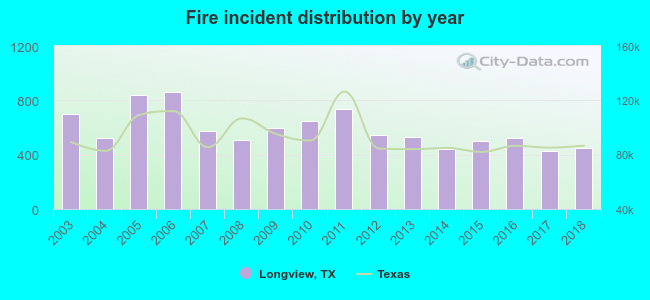 According to the data from the years 2003 - 2018 the average number of fires per year is 587. The highest number of fires - 858 took place in 2006, and the least - 426 in 2017. The data has a declining trend.
The average number of yearly fire incidents per 10k residents in Longview, TX compared to nearest cities:
(Note: Based on data for the last 3 years, including only cities with population 5,000 and above)
| Longview: | 57.1 |
| White Oak: | 55.9 |
| Kilgore: | 113.1 |
| Gladewater: | 86.0 |
| Harleton: | 1.6 |
| Gilmer: | 449.8 |
| Marshall: | 79.8 |
| Henderson: | 177.9 |
| Whitehouse: | 45.6 |
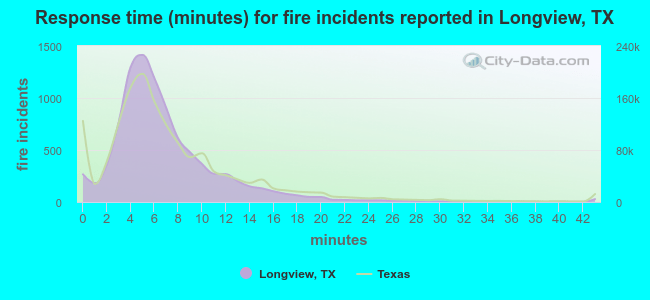 The median response time based on all reported fire incidents is 6 minutes. This is about the same as the state median value.
The median response time in Longview, TX compared to nearest cities:
(Note: Based on data for all years, including only cities with at least 500 fire incidents)
| Longview: | 6 minutes |
| White Oak: | 6 minutes |
| Hallsville: | 9 minutes |
| Kilgore: | 8 minutes |
| Gladewater: | 7 minutes |
| Gilmer: | 8 minutes |
| Overton: | 6 minutes |
| Marshall: | 5 minutes |
| Winona: | 15 minutes |
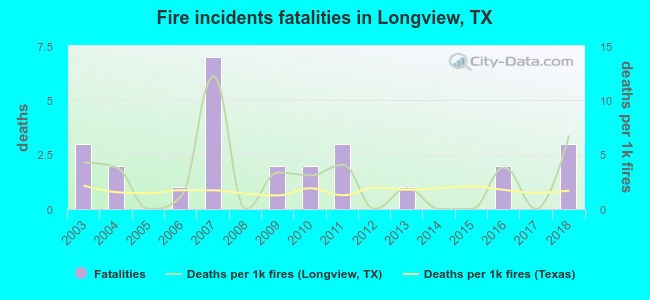 According to the data from the years 2003 - 2018 the average number of fire-related yearly deaths is 2. The highest number of deaths - 7 took place in 2007, and the lowest - 0 in 2005. The data has a constant trend.
The average number of fatalities per 1,000 fire incidents is 3. This indicator was the highest - 12 in 2007, and the lowest 0 in 2005. The trend for fatalities per 1,000 fires is growing. Compared to the state value the number of fatalities per 1,000 fire incidents is higher.
According to the data from the years 2003 - 2018 the average number of fire-related yearly deaths is 2. The highest number of deaths - 7 took place in 2007, and the lowest - 0 in 2005. The data has a constant trend.
The average number of fatalities per 1,000 fire incidents is 3. This indicator was the highest - 12 in 2007, and the lowest 0 in 2005. The trend for fatalities per 1,000 fires is growing. Compared to the state value the number of fatalities per 1,000 fire incidents is higher.
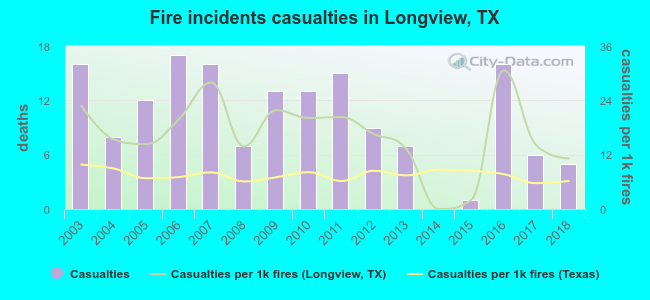 Based on the data from the years 2003 - 2018 the average number of fire-related casualties per year is 10. The highest number of casualties - 17 took place in 2006, and the lowest - 0 in 2014. The data has a declining trend.
The average number of injuries per 1,000 fires is 17. This indicator was the highest - 31 in 2016, and the lowest 0 in 2014. The trend for injuries per 1,000 fires is declining. Compared to the state value the number of casualties per 1,000 fire incidents is much higher.
Based on the data from the years 2003 - 2018 the average number of fire-related casualties per year is 10. The highest number of casualties - 17 took place in 2006, and the lowest - 0 in 2014. The data has a declining trend.
The average number of injuries per 1,000 fires is 17. This indicator was the highest - 31 in 2016, and the lowest 0 in 2014. The trend for injuries per 1,000 fires is declining. Compared to the state value the number of casualties per 1,000 fire incidents is much higher.Casualties per 1,000 incidents in Longview, TX compared to nearest cities:
(Note: Based on data for all years, including only cities with at least 500 fire incidents)
| Longview: | 17.1 |
| White Oak: | 3.1 |
| Hallsville: | 3.8 |
| Kilgore: | 7.8 |
| Gladewater: | 8.7 |
| Gilmer: | 3.3 |
| Overton: | 0.0 |
| Marshall: | 13.0 |
| Winona: | 3.2 |
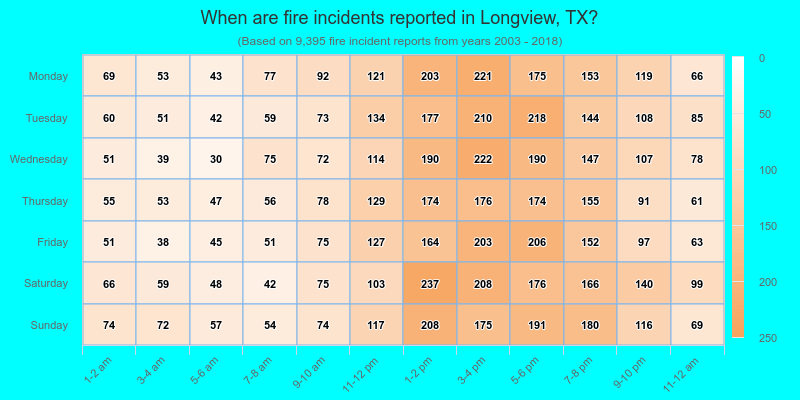
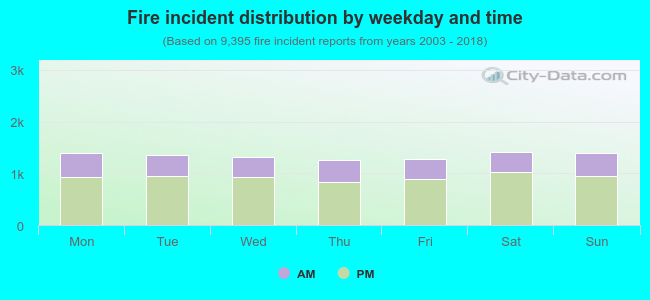 30.9% incidents where reported in the morning and 69.1% in the evening. The most fires (15.1%) took place on Saturday, and the least (13.3%) on Thursday.
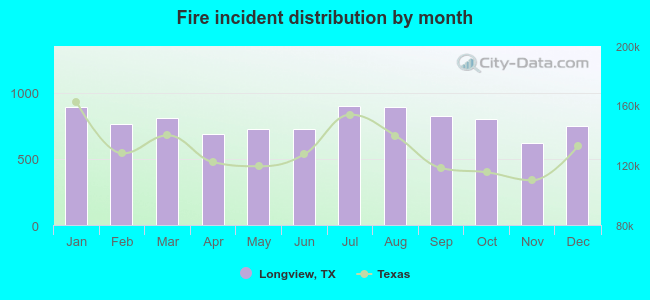 According to the 9,395 incident reports from years 2003 - 2018 most fires (9.6%) took place during July, and the least (6.6%) in November.
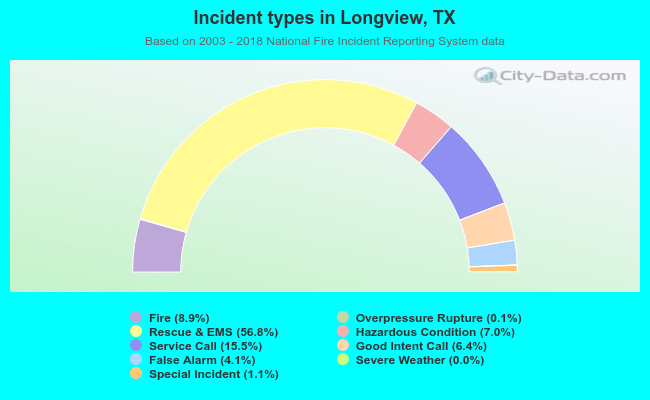 Out of all 105,763 cases reported during the years 2003 - 2018, the most belonged to the categories: Rescue & EMS (56.8%), Service Call (15.5%), and Fire (8.9%).
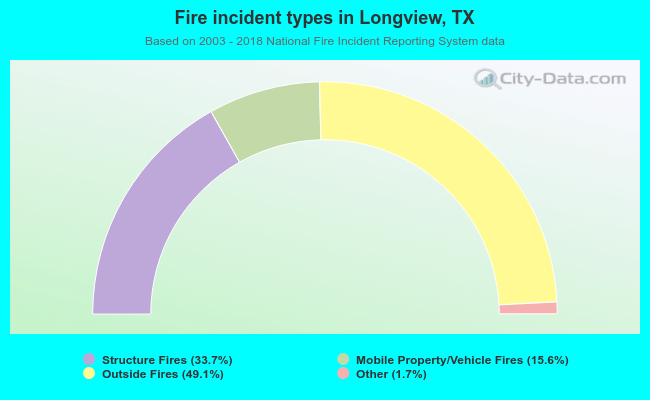 When looking into fire subcategories, the most reports belonged to: Outside Fires (49.1%), and Structure Fires (33.7%).